Bank stocks remain central to equity markets because banks sit at the core of the financial system. They lend to households and businesses, facilitate payments, support capital markets, and influence credit conditions across the economy. As a result, their earnings tend to respond quickly to changes in interest rates, economic growth, and market sentiment.
Now into the second quarter of 2026, the banking sector is navigating a transition phase that has become more complex than anticipated at the start of the year. After a period defined by aggressive rate hikes and inflation volatility, central banks have largely shifted towards stabilisation, though the pace of easing has been slower and more uneven than markets initially expected. This shift continues to alter the earnings backdrop for banks, as net interest margins, loan growth, and capital markets activity respond to a higher-for-longer rate environment.
At the same time, structural forces are reshaping the industry. The implementation of Basel III/3.1 standards, increasing regulatory clarity around digital assets, and accelerating artificial intelligence adoption are influencing the different types of bank stocks and their competitive positioning.
Taken together, these factors may make the second half of 2026 an important period for understanding how different banking institutions are positioned within a changing macro and regulatory environment.
This article discusses publicly listed banking institutions for general market understanding. Traders may gain exposure to bank share price movements through derivative products such as CFDs, where available. CFDs are derivative instruments and do not confer ownership of the underlying shares.
Key Points
- Bank stocks are in focus through mid-2026 as interest rate normalisation, regulatory change, and uneven economic growth continue to shape sector dynamics.
- Large US banks differ in positioning, with outcomes shaped by business mix, balance sheet strength, technology investment, and exposure to capital markets activity.
- Differences in fundamentals, rather than headlines, may influence how individual banks perform.
What are Bank Stocks and Why Do They Matter?
Bank stocks form part of the broader financial stocks sector and represent shares in publicly listed banking institutions. They provide exposure to lending activity, capital markets operations, payment services, and wider economic conditions. Because banks sit at the centre of the financial system, their earnings often respond to interest rate changes, credit demand, and market sentiment.
Banks play a fundamental role in the economy. They provide mortgages and consumer loans, extend credit to businesses, finance mergers and acquisitions, and support payment systems. As a result, trends in bank performance can reflect shifts in economic momentum before they become visible in other sectors.
Banking institutions generally fall into three categories:
- Retail Banks: Focus on consumer banking services such as deposits, mortgages, and personal loans.
- Investment Banks: Specialise in trading, underwriting, and advisory services.
- Diversified Banks: Operate across consumer, corporate, and capital markets businesses.
The effect of monetary policy also varies between these business models. Understanding the relationship between bank stocks and interest rates can help explain why retail-focused banks, investment banks, and diversified institutions may respond differently to the same rate decision.
1. JP Morgan Chase
JPMorgan Chase & Co. is a leading US bank holding company and global financial services firm headquartered in New York City. It is among the world’s largest banks by assets and market capitalization, offering services in investment banking, commercial banking, asset management, and financial transaction processing.
As of 31 March 2026, J.P. Morgan Asset Management manages USD4.3 trillion in assets under management (AUM) [1]. This is distributed across asset classes including equity, money market, fixed income, multi-asset solutions and alternatives. The stock trades under the ticker symbol JPM.
Technical Analysis — June 2025 to June 2026
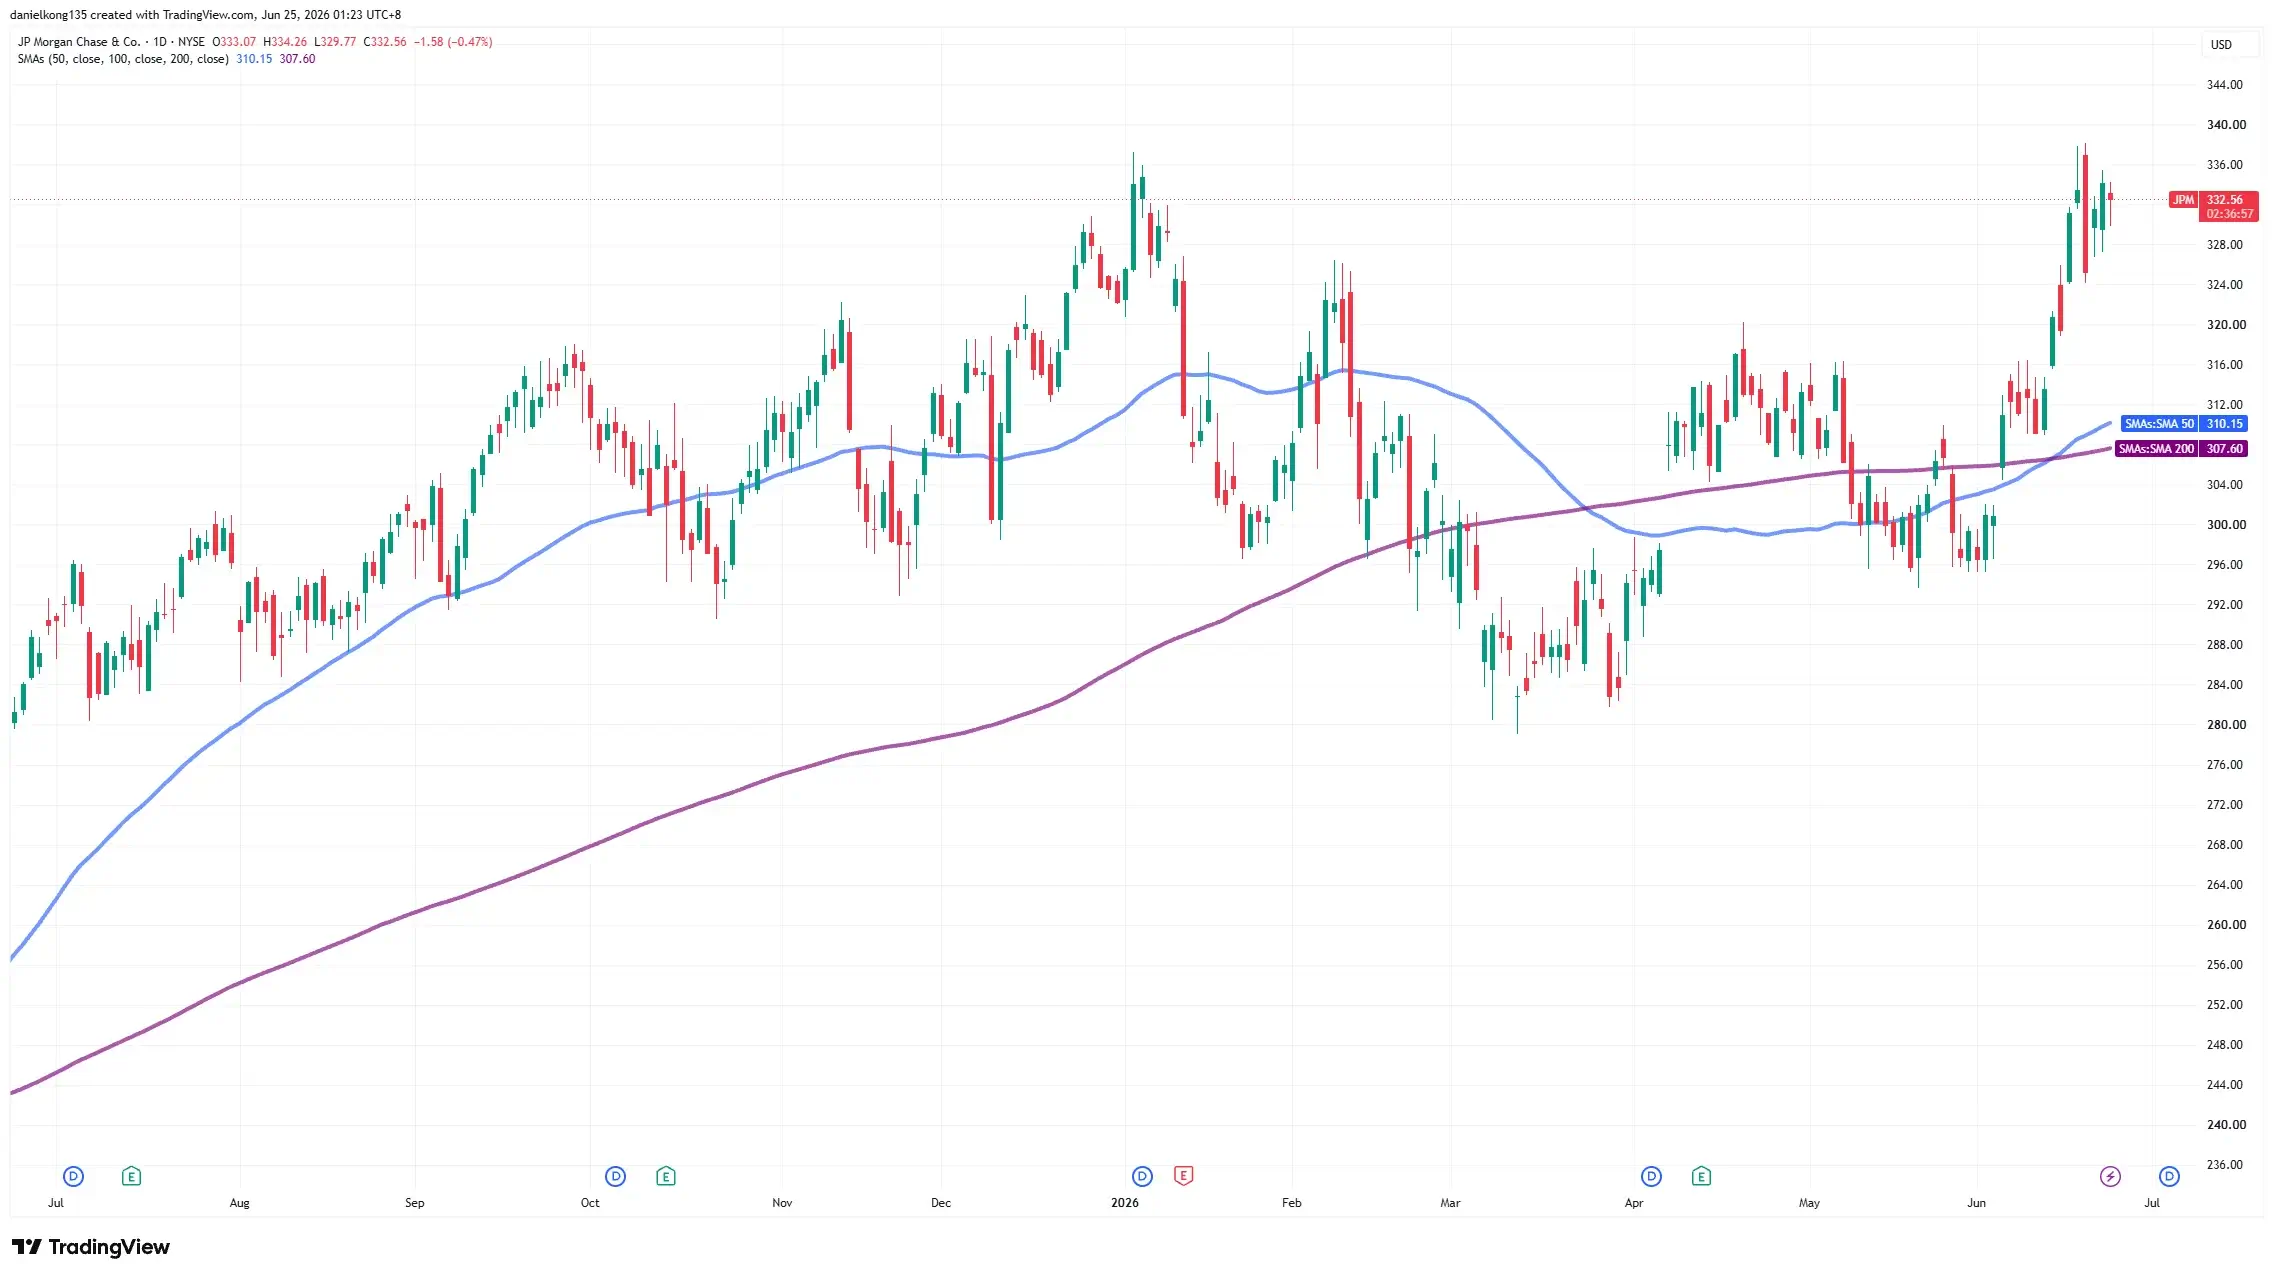
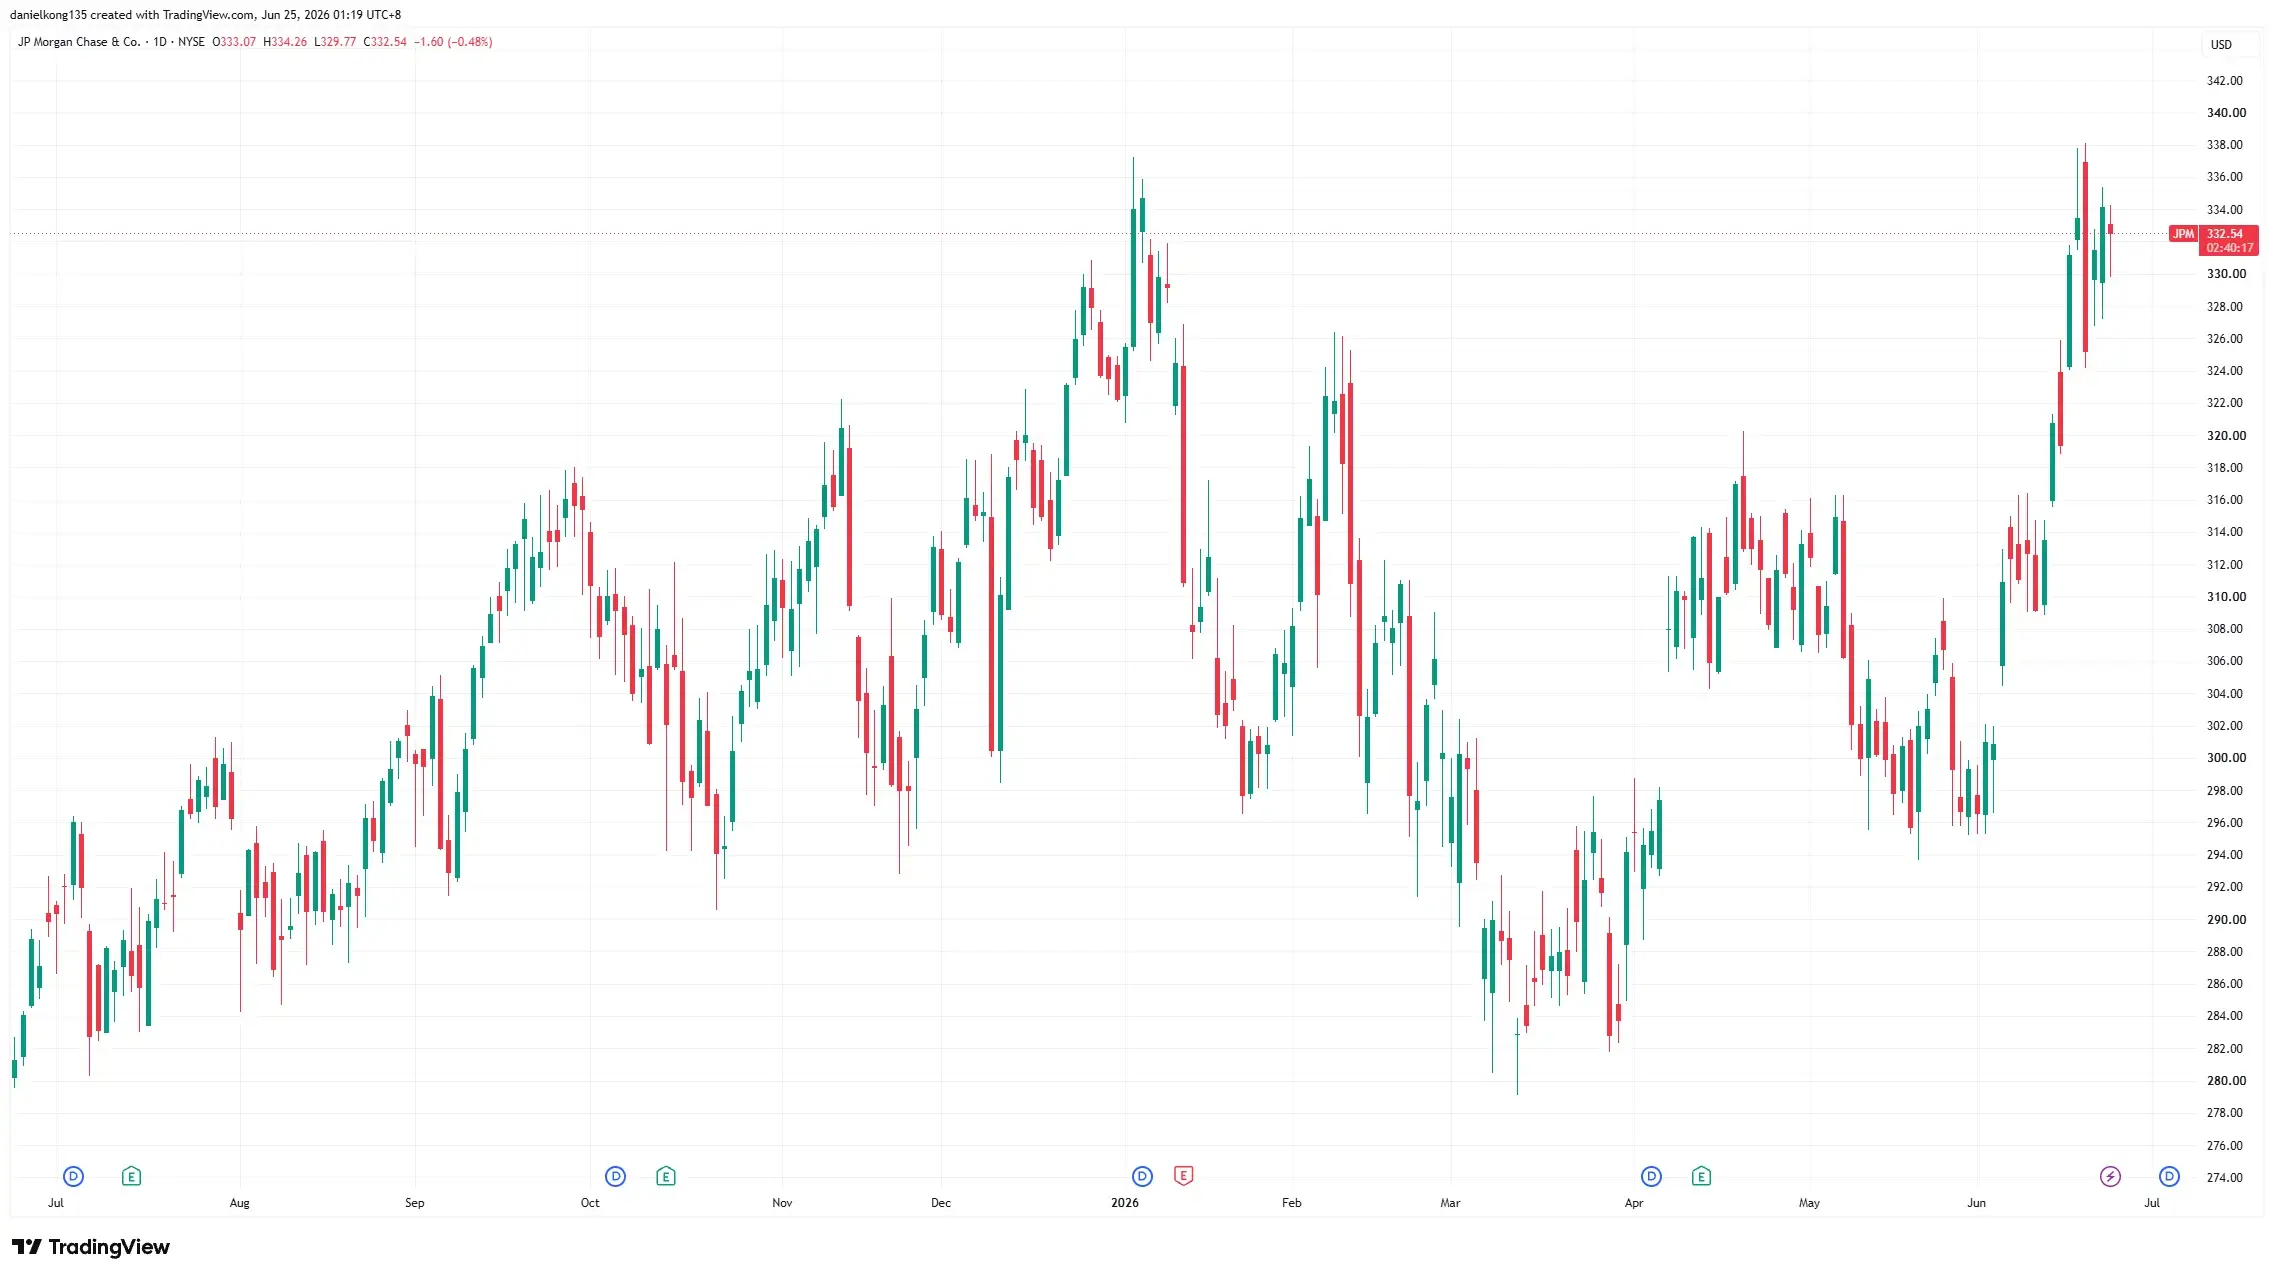
The screenshot above shows JPM’s price movements from June 2025 to June 2026, with its 50-day and 200-day moving averages overlaid. These indicators form part of technical analysis, which examines historical price behaviour and market patterns. Technical analysis does not predict future performance.
JPM traded broadly higher through 2025, building an extended uptrend that carried the stock from lows near USD256 in May 2025 to an all-time high of approximately USD337 in early January 2026.
The stock consistently held above its rising 200-day moving average throughout the advance, with the 50-day moving average acting as dynamic support during pullbacks. This price structure reflected sustained investor confidence in the bank’s earnings resilience and balance sheet strength.
From that January 2026 peak, JPM has pulled back to the USD310–315 range as of early June 2026, a decline of approximately 7% year-to-date, broadly in line with the broader US bank sector. The stock remains above its 200-day moving average, suggesting the longer-term uptrend structure is intact, though the moving averages have begun to flatten. Technical patterns reflect historical price behaviour and do not predict future performance.
Fundamental Analysis of JPMorgan Chase
JPMorgan Chase reported strong first-quarter 2026 results, beating analyst expectations across key metrics. Net income reached USD16.5 billion, up 13% year-on-year, with diluted earnings per share (EPS) of USD5.94 — ahead of the consensus forecast of USD5.46.
Total net revenue rose 10% to USD49.8 billion, driven by higher market revenue, asset management fees, investment banking activity, and net interest income (NII). NII specifically grew 9% year-on-year to USD25.5 billion, supported by balance sheet growth, while noninterest revenue rose 11% to USD25.1 billion.
Return on tangible common equity (ROTCE) stood at 23%, with return on equity (ROE) at 19%. Average loans grew 11% year-on-year to USD1.5 trillion, while average deposits rose 7% to USD2.6 trillion. Credit quality remained manageable, with the provision for credit losses falling 24% to USD2.5 billion and net charge-offs at USD2.3 billion.
The standardised CET1 ratio stood at 14.3%, reflecting a strong capital position. Management maintained full-year 2026 NII guidance of approximately USD103 billion, alongside an adjusted expense outlook of around USD105 billion. The bank also invested heavily in enterprise artificial intelligence (AI), ranking first on the Evident AI Index for the fourth consecutive year in 2025 [2].
JPMorgan Chase Outlook
Looking into the remainder of 2026, several factors may continue to shape JPMorgan Chase’s performance. With the Federal Reserve expected to hold rates at elevated levels before any gradual easing, interest rate volatility is likely to persist. For JPMorgan, this environment supports net interest income through balance sheet growth, though management has modestly trimmed its full-year NII guidance to USD103 billion, citing the impact of lower rates on deposit spreads.
Capital markets activity remains a potential tailwind. Strong investment banking fees and record markets revenue in Q1 2026 reflect improving corporate confidence and deal activity. Management noted that while the macro backdrop involves a “complex set of global risks” — including geopolitical tensions, energy price volatility, and trade uncertainty — the bank’s diversified business model and fortress balance sheet position it to absorb potential shocks while continuing to invest in technology and market expansion.
The CET1 ratio of 14.3% and approximately USD1.5 trillion in liquidity sources provide substantial capacity heading into the second half of the year [3].
2. Bank of America
Bank of America is one of the world’s largest retail and investment banks, providing a broad spectrum of financial services to consumers, small businesses, corporations, and governments. Headquartered in Charlotte, North Carolina, it serves about 70 million US clients and operates in more than 35 countries. Its scale and digital innovation make it a cornerstone of global banking and wealth management.
As of 31 March 2026, Bank of America reported managing approximately USD4.6 trillion in client balances across its wealth management businesses [4]. Its stock trades under the ticker symbol BAC.
Technical Analysis — June 2025 to June 2026
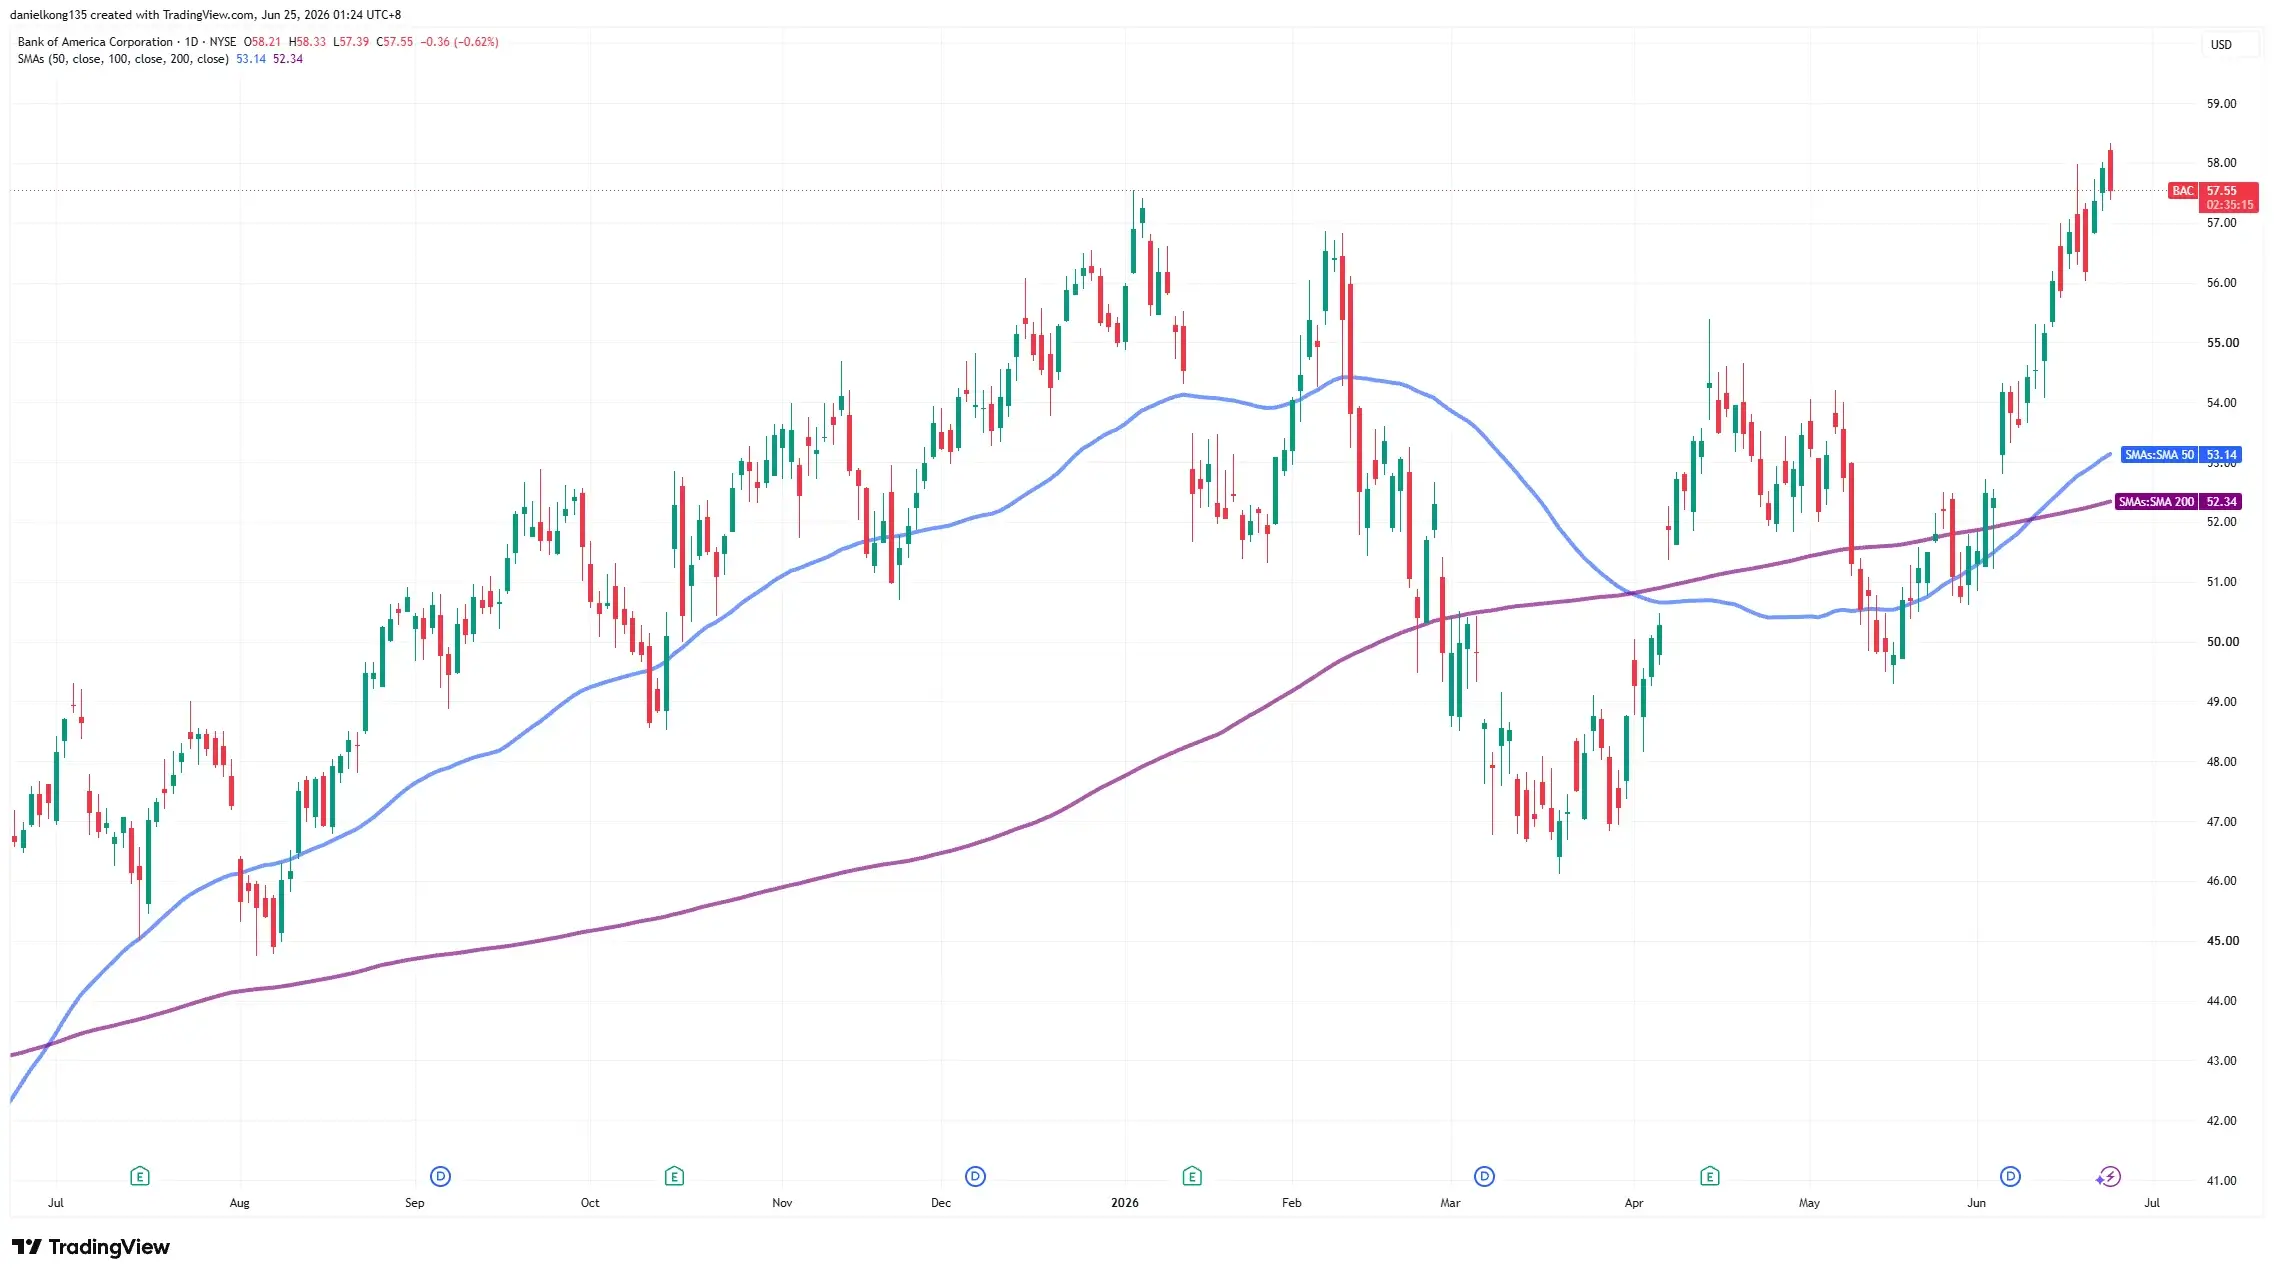
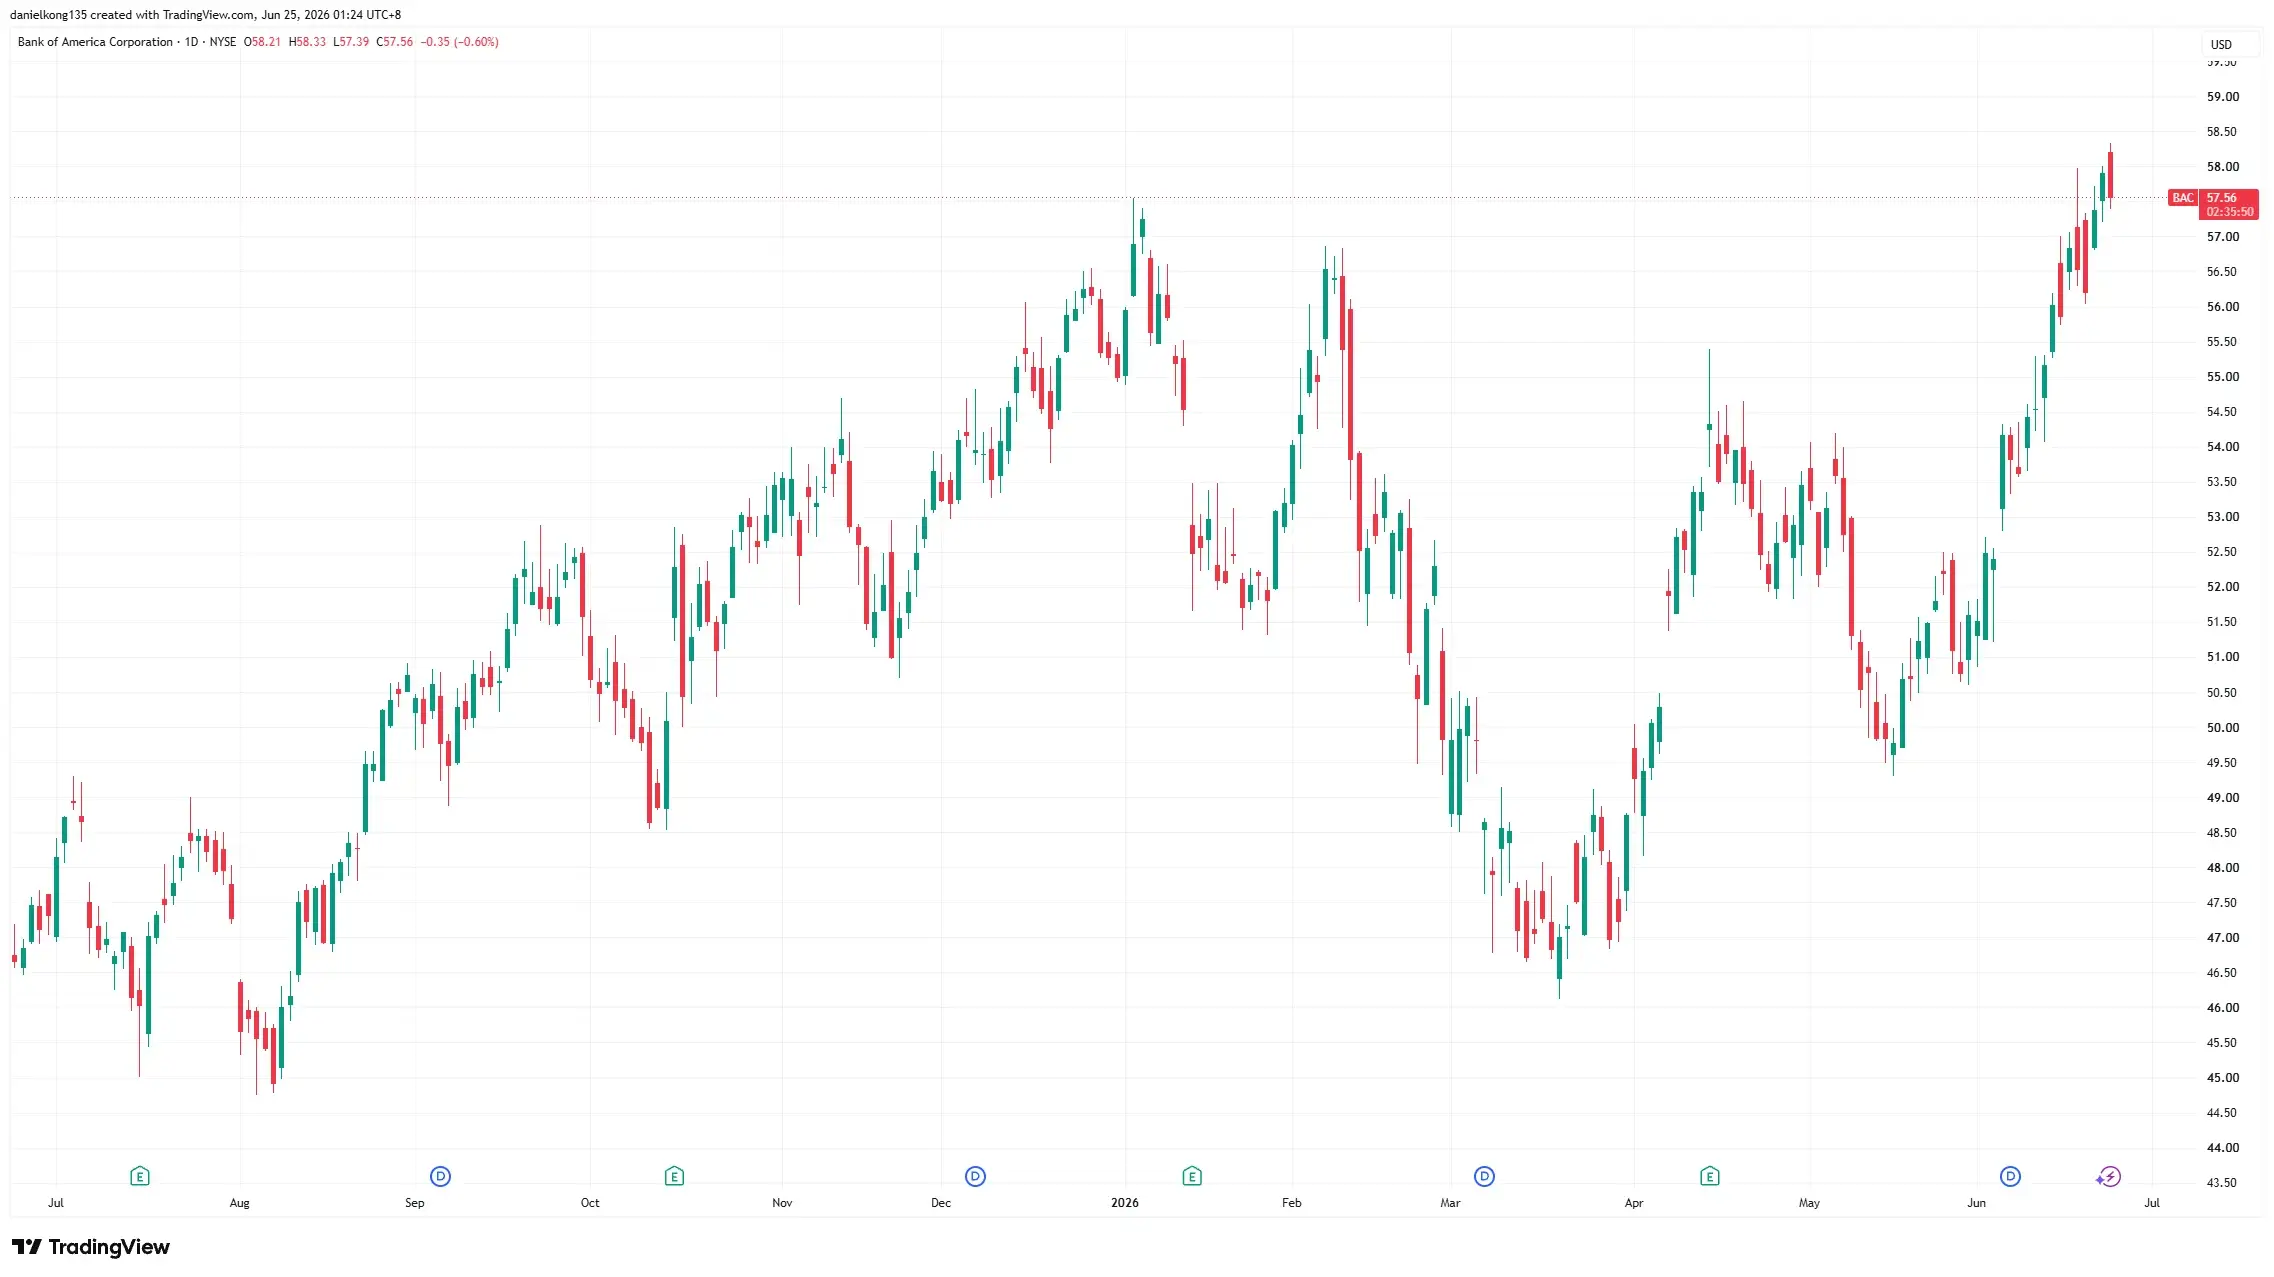
The screenshot above shows the price chart for BAC from June 2025 to June 2026, with the 50-day and 200-day moving averages overlaid. BAC charted a broadly similar pattern to JPM during this period.
However, BAC is more volatile in comparison, with choppier price action. The 50-day moving average (in light blue) also crossed and briefly stayed under the 200-day moving average in the middle of the year, suggesting slackened confidence.
Since that January 2026 peak, BAC has pulled back approximately 4% year-to-date to trade near USD54–55 as of early June 2026, broadly in line with the wider US bank sector. The stock has held above its 200-day moving average through this pullback, though the average has begun to flatten. These price movements illustrate historical volatility rather than future performance.
Fundamental Analysis of Bank of America
Bank of America reported strong first-quarter 2026 results, beating Wall Street expectations across key metrics. Net income rose 17% year-on-year to USD8.6 billion, with diluted EPS up 25% to USD1.11 — the highest EPS in nearly two decades and ahead of the consensus estimate of USD1.01. Total revenue grew 7% to USD30.3 billion, driven by higher NII, sales and trading revenue, asset management fees, and investment banking activity [5].
Net interest income (NII) grew 9% year-on-year to USD15.7 billion, beating estimates and prompting management to raise full-year 2026 NII growth guidance to 6–8%. Average loans grew 9% year-on-year to USD1.19 trillion, with growth across every business segment, while average deposits reached USD2.02 trillion — the eleventh consecutive quarter of sequential growth [6].
Equities trading revenue jumped 30% to USD2.83 billion, the best quarter in 15 years, and investment banking fees climbed 21% to USD1.8 billion. ROTCE improved to 16%, and the CET1 ratio stood at 11.2%, well above regulatory minimums. The bank returned USD9.3 billion to shareholders via dividends and buybacks in the quarter.
Bank of America Outlook
For the remainder of 2026, Bank of America’s performance will remain closely tied to the interest rate environment. Management’s raised NII guidance assumes no further rate cuts in the current rate curve, with moderate loan and deposit growth. A 100 basis point rate decline would reduce NII by approximately USD2 billion over 12 months, while a 100 basis point increase would add a little under USD500 million — underscoring how rate-sensitive BofA’s earnings remain. With deposits exceeding USD2 trillion and loans continuing to grow across every segment, the bank’s funding position looks stable heading into the second half of the year.
Beyond NII, capital markets activity is emerging as a meaningful secondary driver. The 30% jump in equities trading and 21% rise in investment banking fees in Q1 2026 demonstrate that BofA’s Global Markets segment is capable of contributing meaningfully during periods of volatility — a dynamic that may persist if geopolitical uncertainty and market dispersion continue through the year. Management expects to maintain more than 200 basis points of positive operating leverage for the full year, supported by continued expense discipline and the bank’s ongoing shift of resources toward revenue-producing roles.
3. Morgan Stanley
Founded by Henry S. Morgan and Harold Stanley following the restructuring of J.P. Morgan & Co. to comply with banking reforms, Morgan Stanley quickly rose to become one of the largest investment banks in the United States. Headquartered in New York, the firm maintains major offices in financial centers including London, Hong Kong, Tokyo, and Singapore.
Morgan Stanley operates three main business segments. Its Institutional Securities arm provides investment banking, trading, research, and lending for corporations and governments. Meanwhile, its Wealth Management business offers advisory and financial planning for individuals and smaller institutions, bolstered by acquisitions such as E*TRADE (2020). Finally, its Investment Management unit provides asset management across equities, fixed income, and alternatives. In 2021, this unit was strengthened by the purchase of Eaton Vance.
As of Q1 2026, Morgan Stanley’s total client assets across wealth and investment management platforms exceed USD9 trillion, sustaining progress toward its USD10 trillion goal. Investment Management AUM stands at USD1.9 trillion, with long-term net flows of USD3.3 billion in the quarter [7,8].
Technical Analysis — June 2025 to June 2026

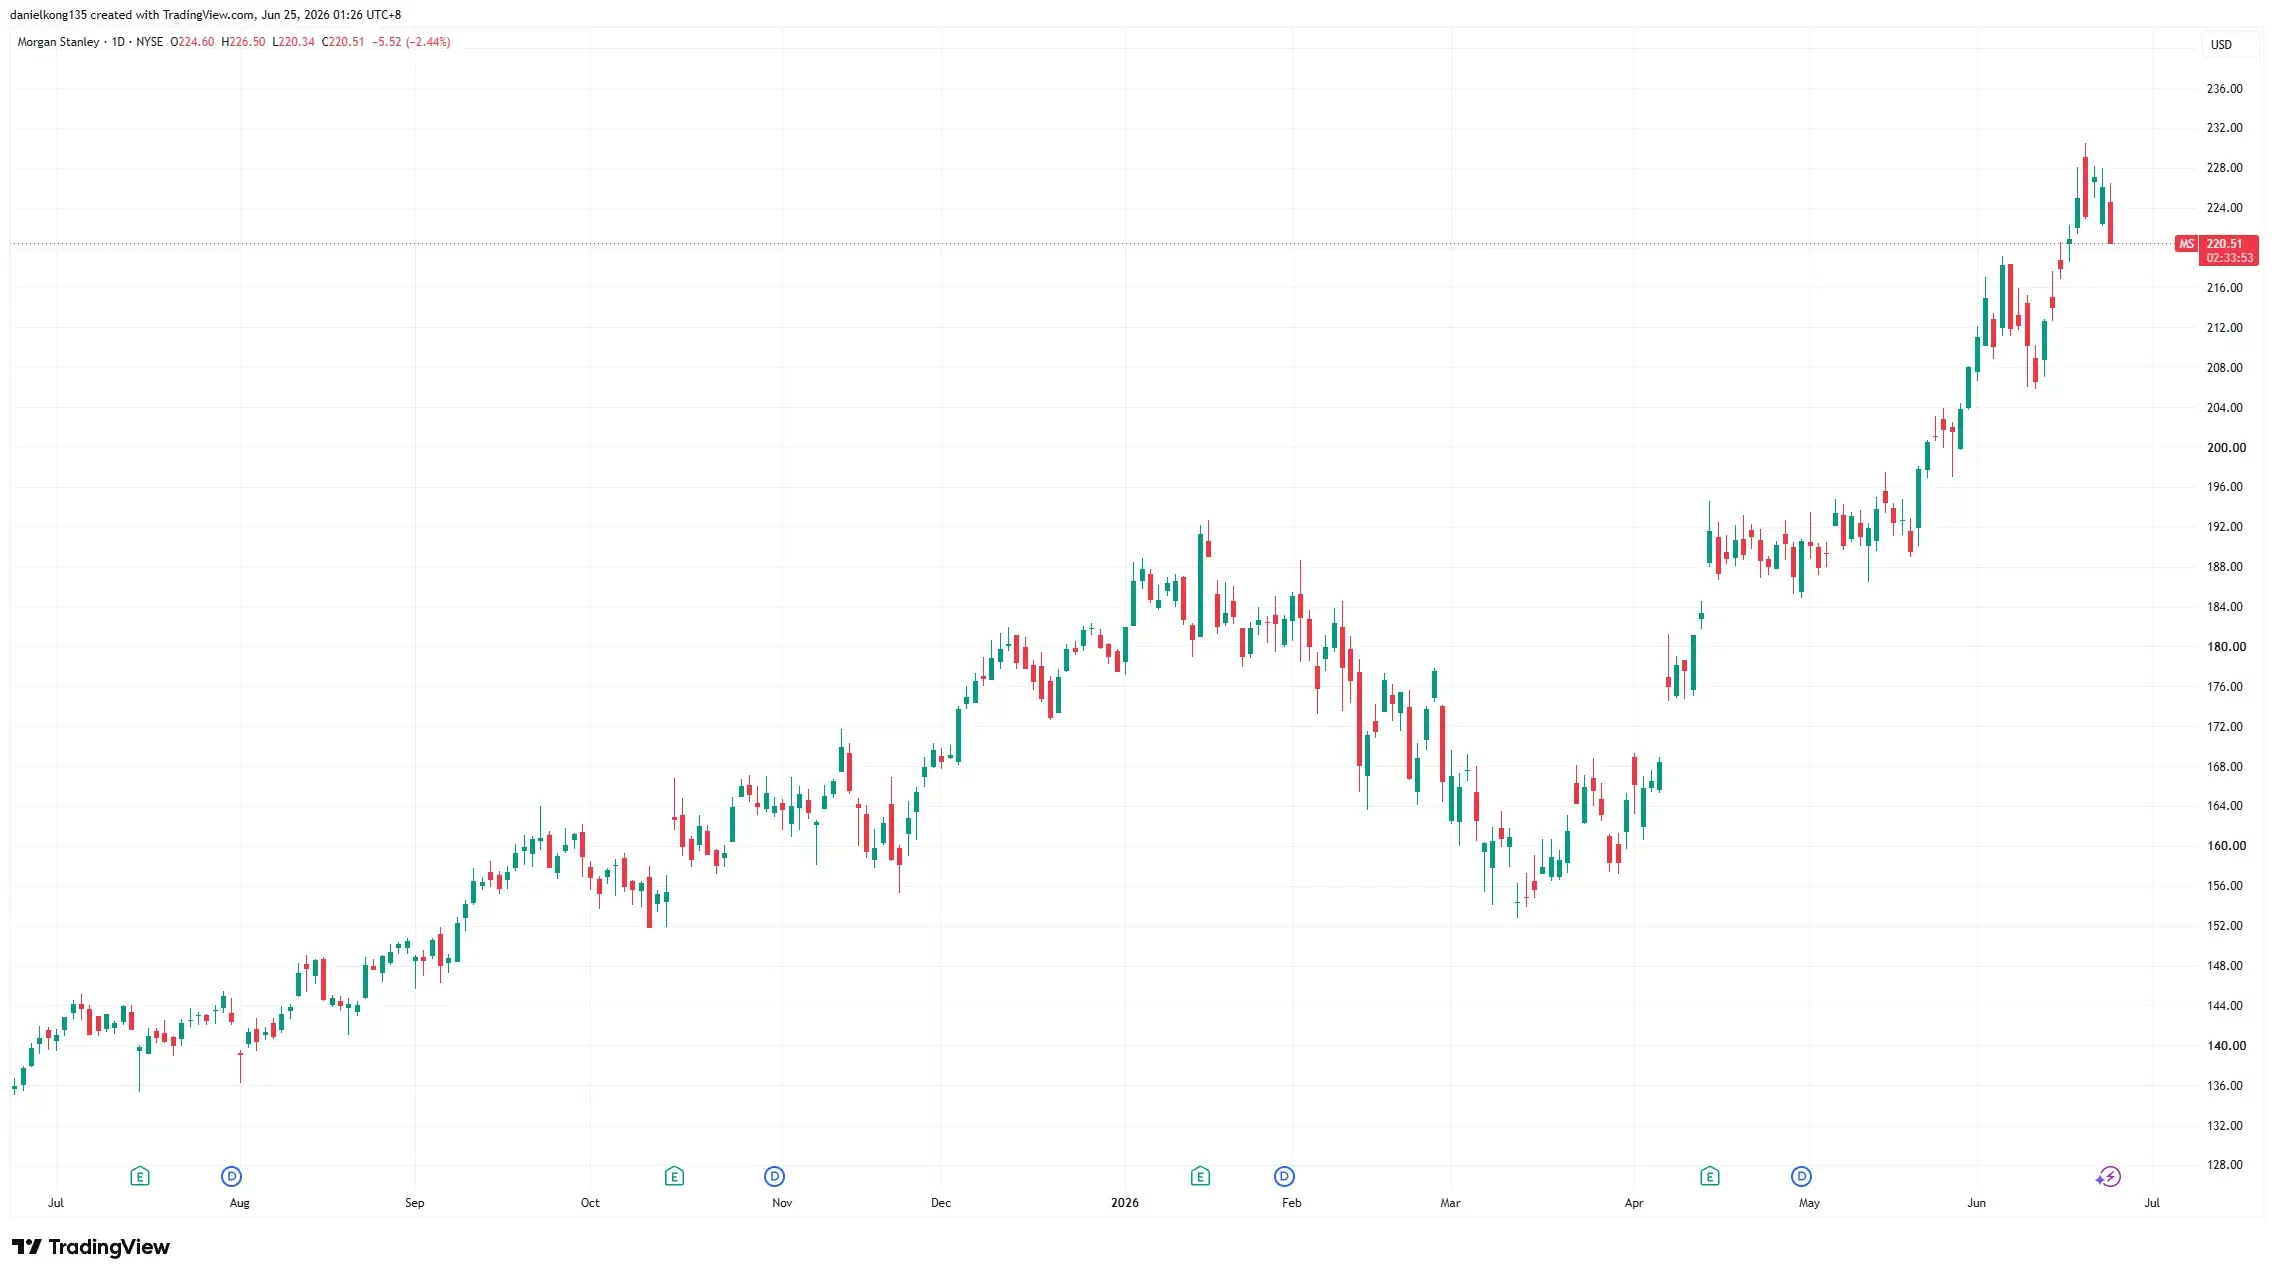
Learning how to read stock charts can help provide context for trends, support and resistance levels, trading volume, and changes in momentum. Over the period shown, Morgan Stanley was among the most volatile of the five bank stocks covered in this article. Morgan Stanley’s stock fell sharply in early 2025, hitting a 52-week low near USD94 in early April during a broader market sell-off, before staging a decisive reversal.
The decline reversed shortly after, with the stock showing steady growth from May 2025 onwards, indicating improving market performance during this period. In the second half of the year, the stock traced a near-perfect trajectory, convincingly breaking key resistance levels all along the way.
By early June 2026, MS had continued to advance beyond its January peak to trade near USD215, reflecting positive reception to record Q1 2026 earnings and the firm’s resilient wealth management franchise. The stock is trading above both the 50-day and 200-day moving averages. These price movements illustrate historical price behaviour and do not predict future performance.
Fundamental Analysis of Morgan Stanley
Morgan Stanley reported a record quarter in Q1 2026, with net revenues of USD20.6 billion — the highest in the firm’s history — up 16% year-on-year. Net income applicable to common shareholders reached USD5.4 billion, and diluted EPS rose to USD3.43 from USD2.60 a year earlier. ROTCE hit 27.1%, well above the firm’s 20% target, and ROE reached 21.0% [7].
Institutional Securities generated record net revenues of USD10.7 billion, with investment banking revenues up 36% to USD2.1 billion on higher completed M&A and underwriting activity. Wealth Management produced record revenues of USD8.5 billion, up 16%, supported by USD118 billion of net new assets and USD54 billion in fee-based asset flows — at a pre-tax margin of 30.4% [8].
Investment Management revenues were USD1.5 billion with total AUM at USD1.9 trillion and long-term net flows of USD3.3 billion. Total client assets across Wealth and Investment Management exceeded USD9 trillion, on course toward the firm’s USD10 trillion goal. CET1 ratio stood at 15.1%, and the firm repurchased USD1.75 billion of common stock in the quarter.
Morgan Stanley Outlook
For the remainder of 2026, Wealth Management is the primary structural growth engine. Management reaffirmed a 30%+ pre-tax margin target for the segment and expects net interest income to build over the course of the year, with a modest increase expected in Q2 relative to Q1. With USD419 billion in deposits and USD1.9 trillion in AUM, the recurring fee-based revenue base provides an important buffer against capital markets volatility.
The Institutional Securities outlook is more tied to deal activity and market conditions. The 36% rebound in investment banking revenues in Q1 2026, led by advisory and strong performance across Asia equities, reflects improving corporate confidence and normalising dealmaking conditions. Management highlighted AI as an accelerating structural theme — using it as “co-pilots” for financial advisers to improve productivity — while also noting that geopolitical uncertainty and higher-for-longer rates remain the key macro risks to monitor in H2 2026.
4. Goldman Sachs

A leading US multinational investment bank and financial services firm headquartered in New York City, Goldman Sachs Group, Inc was founded in 1869 – making it one of the oldest investment banks in the world.
The bank has weathered several market crashes and economic crises throughout its history. Even though many of its peers were irreparably damaged in the 2008 Great Financial Crisis, Goldman Sachs has kept its position as a global leader, and remains one of the world’s most influential institutions in global capital markets.
With a portfolio serving corporations, governments, and individuals through investment banking, securities trading, asset management, and consumer finance, Goldman Sachs has accrued a record USD3.65 trillion in assets under supervision as at Q1 2026 [9]. The firm is headquartered in New York, but has offices around the world. Its stock trades under the ticker symbol GS.
Technical Analysis — June 2025 to June 2026
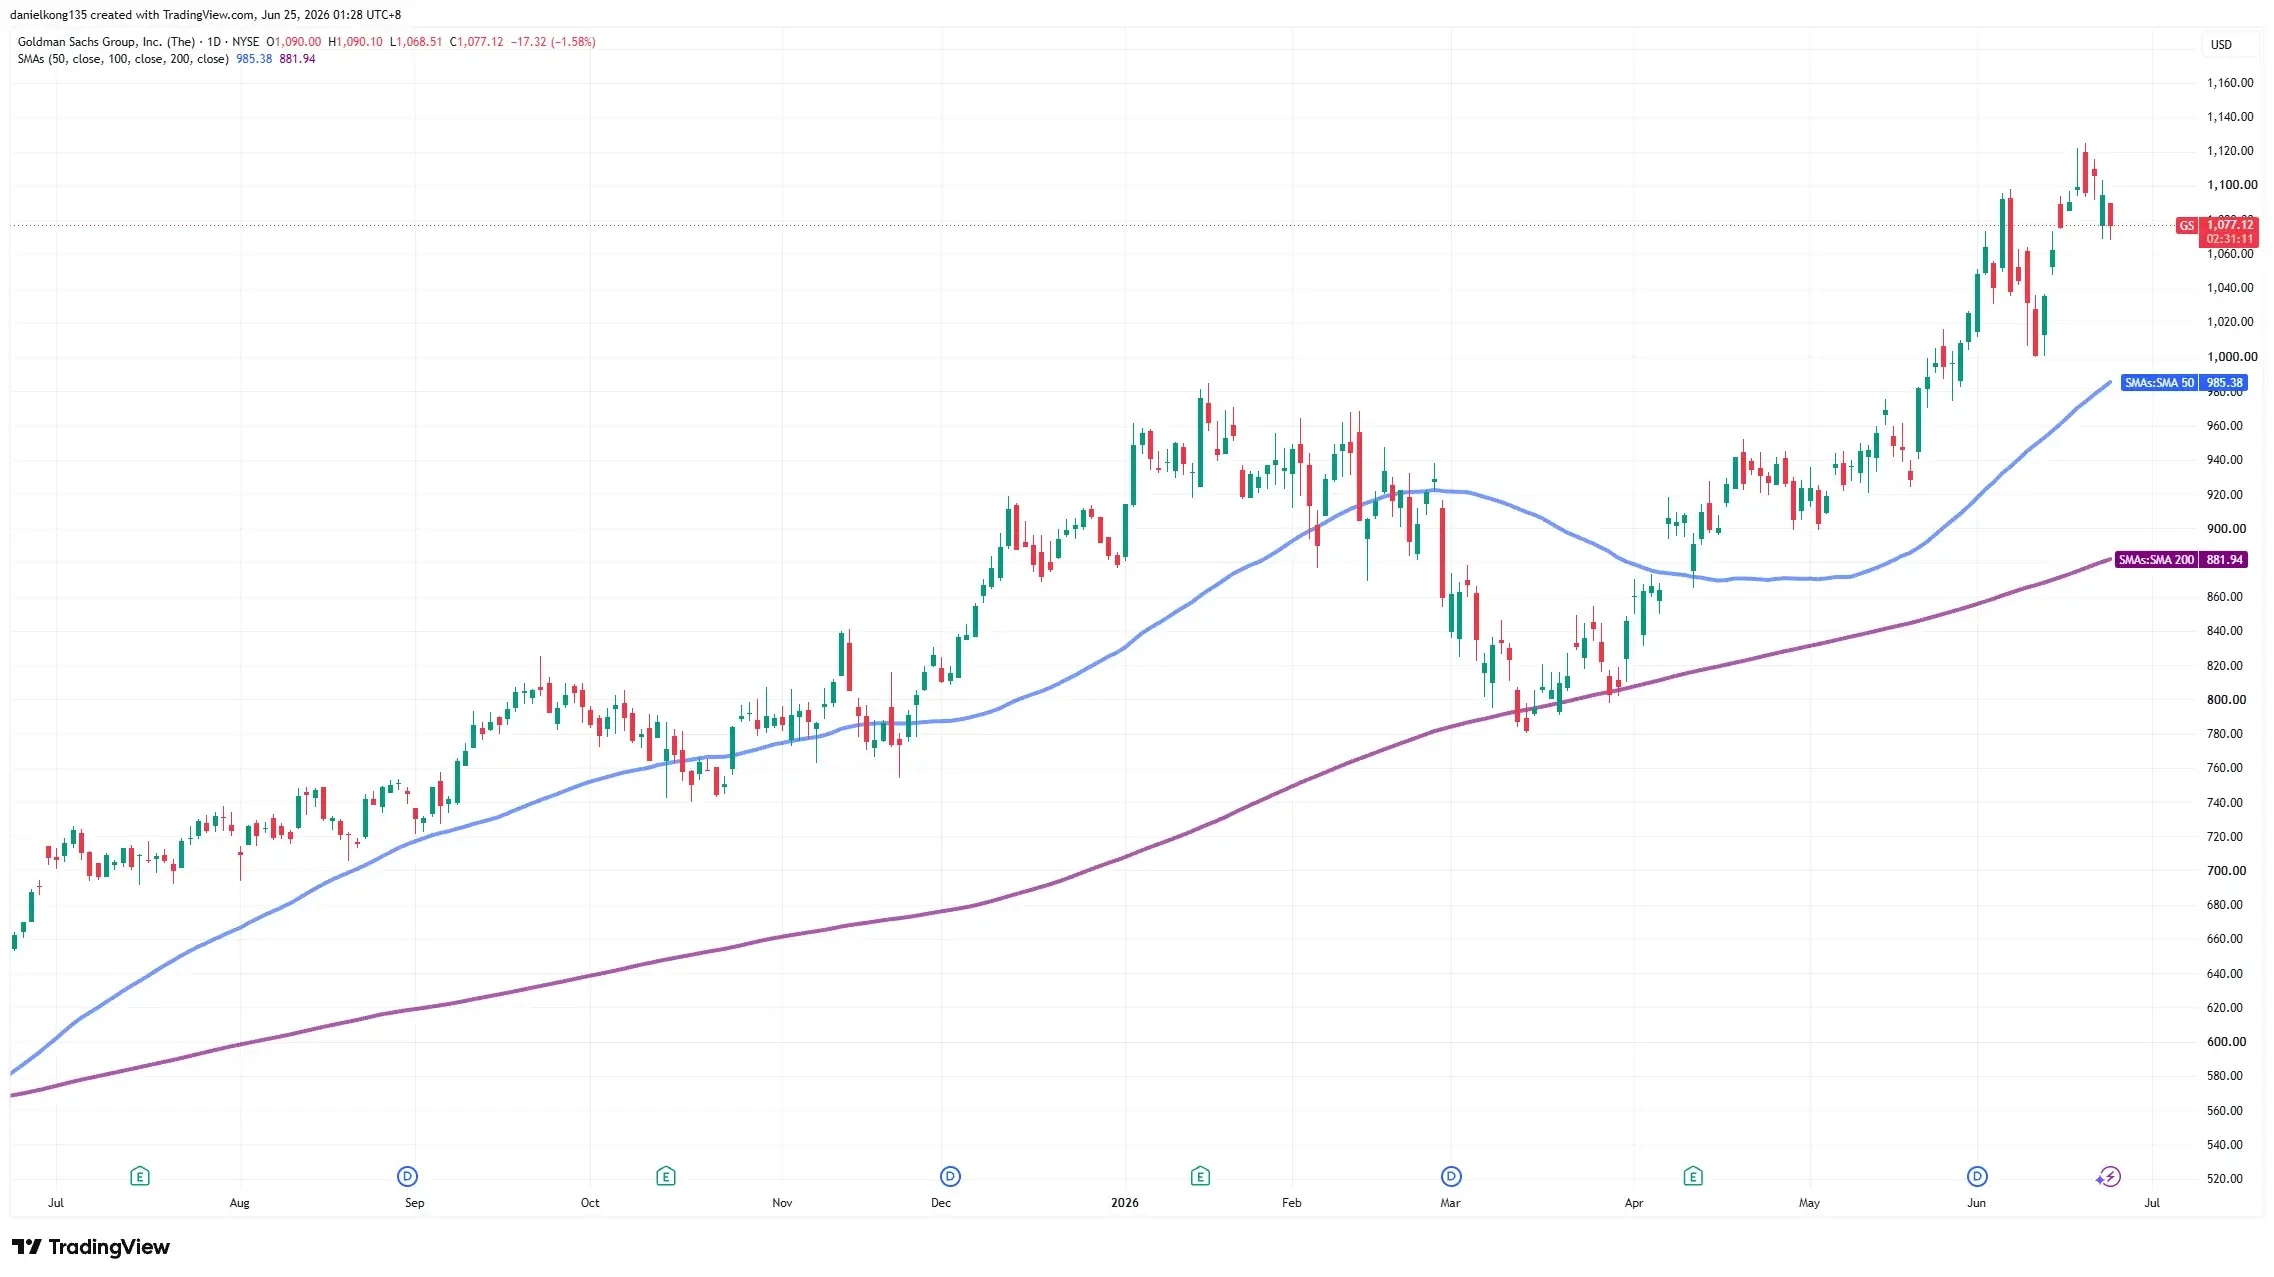
Much like its peers, Goldman Sachs showed a strong uptrend throughout 2025 – but not before a pullback over the first few months of the year. Once the stock moved above its 50-day moving average (light blue line) in the second quarter, it remained largely supported above this level, signalling sustained upside momentum.
The 200-day moving average (dark blue line) trended steadily higher and was not meaningfully tested during the advance, confirming a healthy long-term trend for bullish stock watchers. In the second half of the year, the stock continued to post higher highs and higher lows, with pullbacks appearing controlled rather than trend-breaking.
As of early June 2026, GS trades near USD1,038, up approximately 8% year-to-date — the best YTD performance of the five banks in this article. The stock continues to trade above its rising 200-day moving average. These price movements illustrate historical price behaviour and do not predict future performance.
Fundamental Analysis of Goldman Sachs
Goldman Sachs delivered historically strong results in Q1 2026. Net revenues reached USD17.23 billion — the second highest quarterly total in the firm’s history — up 14% year-on-year. Net earnings rose to USD5.63 billion, with diluted EPS of USD17.55, the second highest ever recorded, well above the analyst consensus of USD16.30. ROE was 19.8% and ROTE 21.3% [9].
Global Banking & Markets generated record revenues of USD12.74 billion, up 19% year-on-year. Investment banking fees surged 48% to USD2.84 billion, with advisory revenue alone up 89% to USD1.5 billion on higher completed M&A volumes — maintaining Goldman’s number one position in M&A league tables.
Equities revenues hit a record USD5.33 billion, up 27%, driven by prime brokerage and record activity in Asia. FICC revenues declined 10% to USD4 billion, reflecting softer intermediation in rates and mortgages. Asset & Wealth Management revenues grew 10% to USD4.08 billion, with assets under supervision reaching a record USD3.65 trillion and long-term fee-based inflows of USD62 billion [10].
Goldman Sachs Outlook
For the remainder of 2026, Goldman Sachs’ performance will largely track the health of capital markets activity. The 48% surge in investment banking fees in Q1 2026 confirms that the dealmaking drought has ended, with M&A advisory, equity issuance, and private market transactions all recovering. CEO David Solomon noted that geopolitical complexity created a volatile trading environment that simultaneously hurt FICC but boosted commodities and equities activity — a bifurcated market dynamic characteristic of Goldman’s revenue mix heading into H2 2026.
The acquisition of Innovator added USD31 billion in assets under supervision and positions Goldman among the top 10 global active ETF providers — a diversification into fee-based asset management that reduces reliance on volatile trading revenues. Management highlighted AI and cloud migration as accelerating structural priorities, with investment in these areas expected to strengthen client-facing capabilities across both institutional and private wealth platforms throughout the remainder of the year.
5. SoFi Technology
Founded in 2011, SoFi Technologies is a US-based digital financial services company that operates at the intersection of banking, lending, payments, and investing. Unlike traditional banks, SoFi was built as a mobile-first platform, targeting younger and digitally native customers with an integrated ecosystem of financial products.
While SoFi does not have the long operating history of legacy banks, it has rapidly expanded its footprint across personal loans, student loan refinancing, mortgages, checking and savings accounts, credit cards, investing, and financial planning tools. The company operates as a regulated bank holding company following its bank charter approval, allowing it to fund loans through customer deposits rather than relying solely on capital markets.
As of Q1 2026, SoFi reported 14.7 million members on its platform and continued growth in deposits, product adoption, and non-lending revenue streams — a 35% increase year-on-year [11]. The stock trades under the ticker symbol SOFI.
Technical Analysis — June 2025 to June 2026

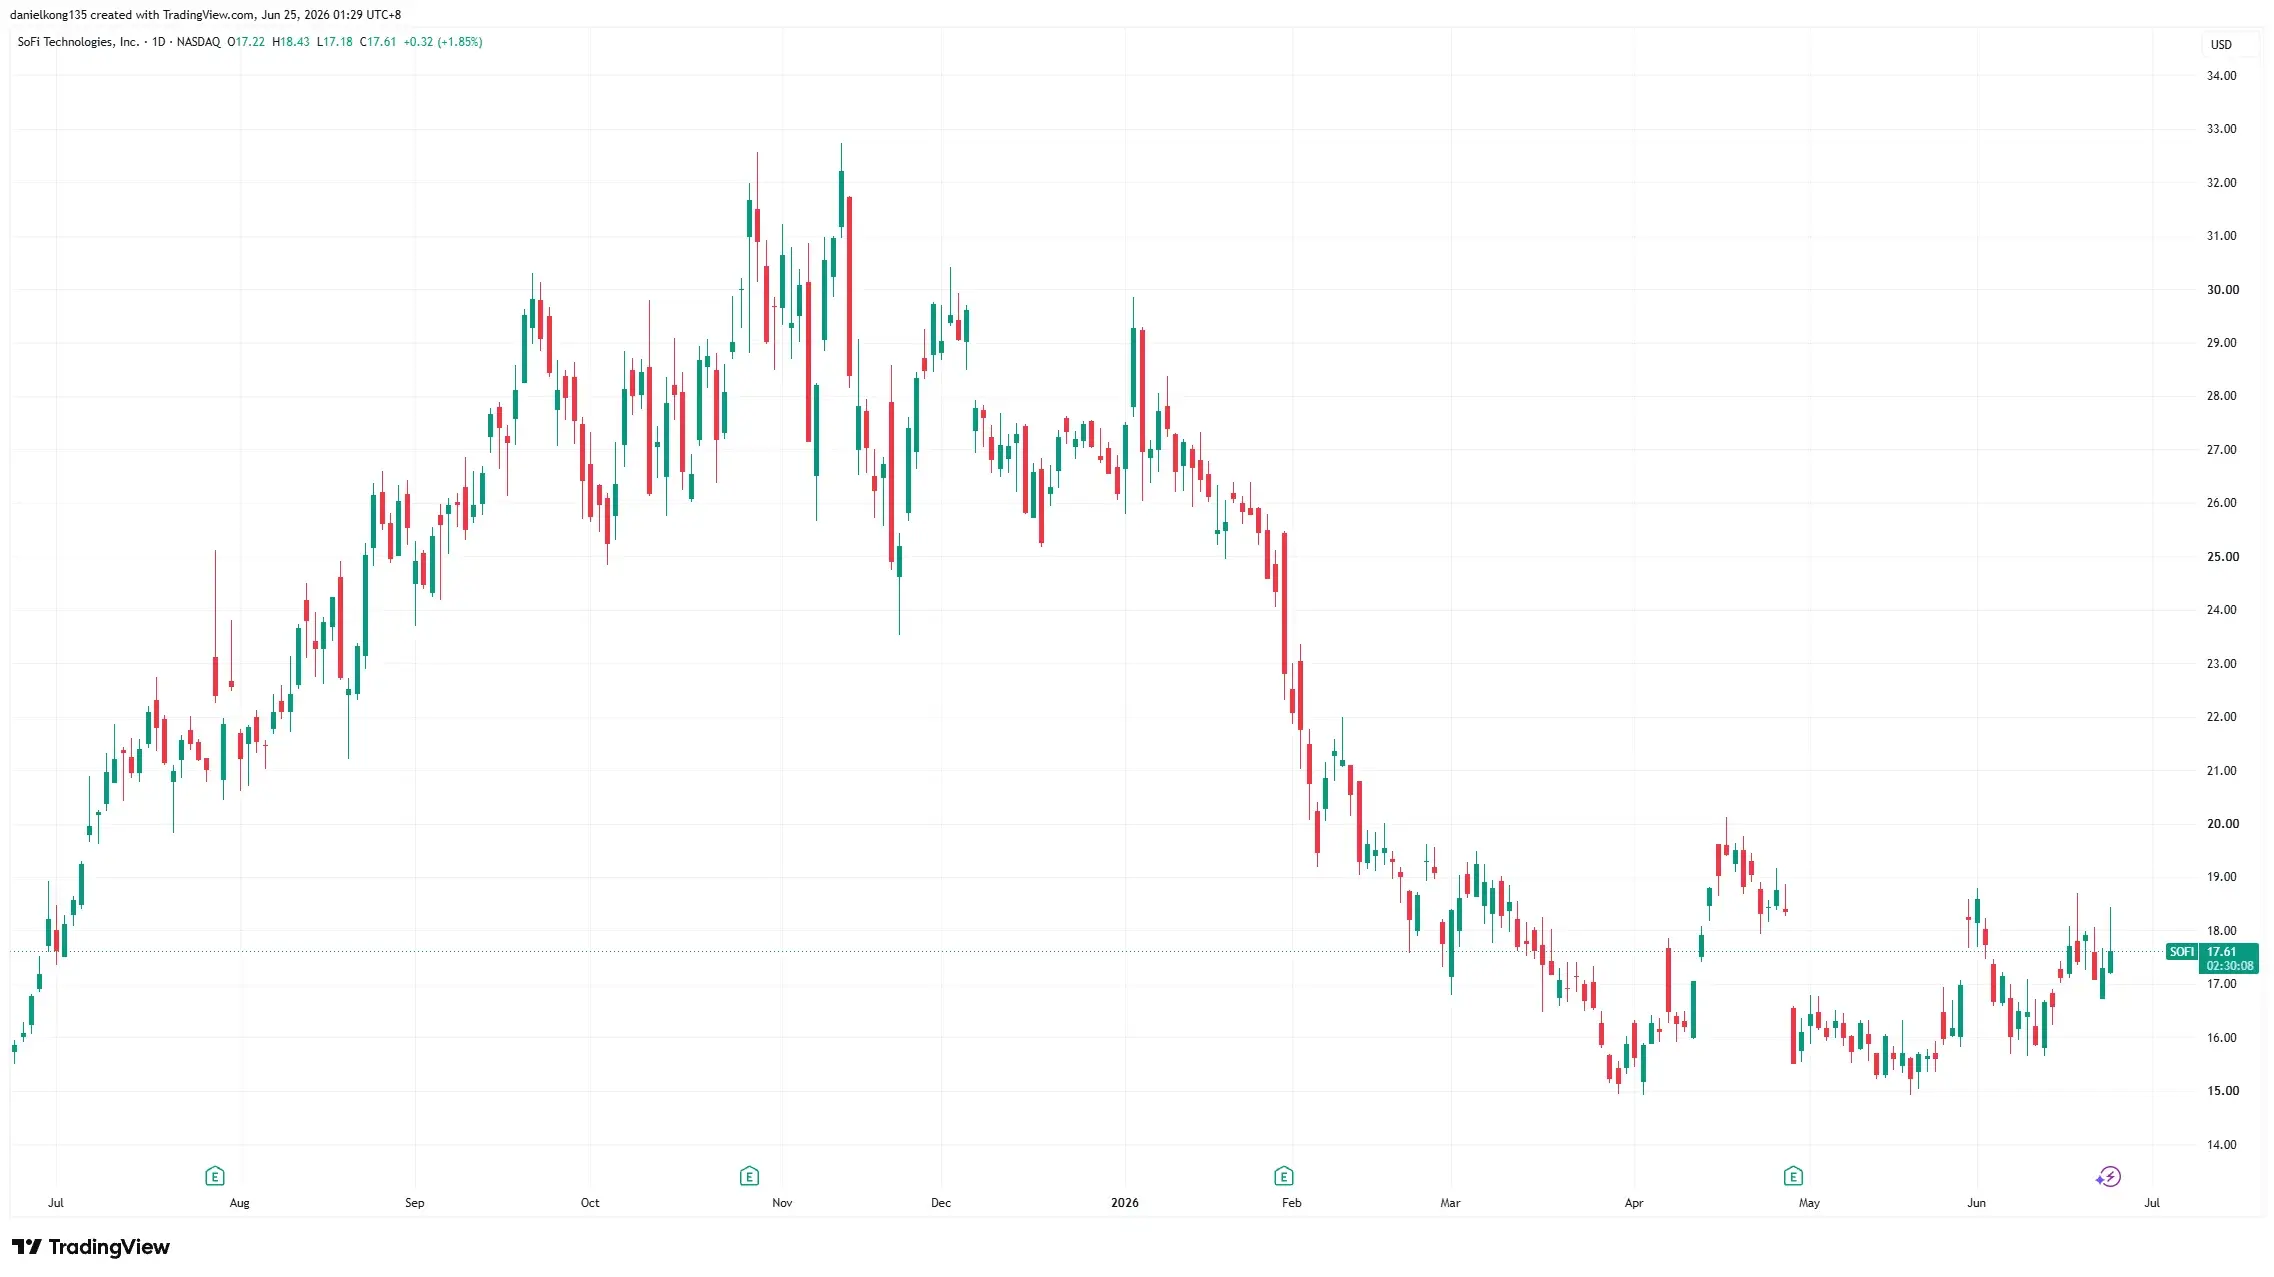
SoFi displayed the widest price range of the five stocks over the chart period, reflecting its significantly higher beta relative to the large-cap bank peers. SoFi entered mid-2025 at depressed levels, then staged a sharp recovery as membership and revenue growth accelerated through the second half of the year.
A key technical development was the stock reclaiming and holding above its 50-day moving average (light blue line) around mid-June. From that point onward, the 50-day moving average acted as dynamic support during pullbacks, signalling improving short- to medium-term momentum. The slope of the 50-day average turned decisively higher through the summer, confirming the strength of the uptrend.
The bullish momentum of the stock was further confirmed by the rising long-term average (as marked by the 200-day moving average, dark blue line), suggesting improving underlying trend strength and growing investor confidence. In the second half of 2025, SoFi transitioned from a strong rally into a consolidation phase above the 200-day average, indicating digestion of gains rather than a breakdown in structure, before resuming upward momentum into 2026.
The disconnect between SoFi’s strong Q1 2026 fundamentals (net income +134%, membership +35%) and its declining share price reflects broader caution around higher-valuation fintech names in a higher-for-longer rate environment. Investors should note that SOFI’s price action tends to be significantly more volatile than the large-cap bank peers. These price movements illustrate historical price behaviour and do not predict future performance.
Fundamental Analysis of SoFi Technologies
SoFi Technologies delivered record results in Q1 2026, its tenth consecutive quarter of GAAP profitability. GAAP net revenue rose 43% year-on-year to USD1.1 billion, while adjusted net revenue grew 41% to USD1.087 billion, beating estimates by approximately 4%. Net income surged 134% to USD167 million, and adjusted EBITDA climbed 62% to USD340 million at a 31% margin. Diluted EPS reached USD0.12 [11].
Total loan originations hit a record USD12.2 billion, up 68% year-on-year, led by personal loans at USD8.3 billion, student loans at USD2.6 billion (up 2.2x), and home loans at USD1.2 billion (up 2.4x). Membership grew 35% year-on-year to a record 14.7 million, adding 1.055 million new members in the quarter. Total products grew 39% to 22.2 million, with products per member rising to 1.51x, reflecting cross-sell deepening. Deposits grew to USD40.2 billion, and total fee-based revenue reached USD386.8 million, up 23%. SoFi was ranked the number one US bank in Forbes’ World’s Best Banks list, and placed first in J.D. Power’s 2026 DIY Investor Satisfaction Study.
SoFi Technologies Outlook
Management reaffirmed full-year 2026 guidance for approximately USD4.655 billion in adjusted net revenue (implying ~30% growth), adjusted EBITDA of ~USD1.6 billion, and adjusted EPS of ~USD0.60. For Q2 2026, SoFi guided for adjusted net revenue of approximately USD1.115 billion and EPS of USD0.10–0.11, reflecting planned acceleration of marketing spend and seasonal payroll tax headwinds [12].
Key variables to watch for the remainder of 2026 include credit quality in SoFi’s personal loan book as consumer spending conditions evolve, the pace of member cross-sell into higher-margin financial products, and the performance of the Technology Platform segment following the exit of a large customer in Q1.
Management confirmed it now expects no Fed rate cuts in 2026 — a higher-for-longer environment that supports net interest margin (5.94% in Q1 2026) but may temper loan origination growth if consumer demand softens. Given its smaller scale relative to the legacy banks covered in this article, SoFi’s stock may remain more sensitive to earnings execution and macro sentiment shifts.
Fundamentals vs Headlines in 2026
Now approaching mid-2026, the banking sector is navigating a more complex environment than the year began with — shaped by slower-than-expected growth, an uneven rate normalisation path, and rising geopolitical uncertainty. Performance is increasingly diverging across institutions based on business mix, balance sheet quality, funding structure, and operational execution.
Large, diversified institutions derive income from multiple sources, including lending, markets, advisory, and asset management. Others are more sensitive to capital markets cycles or digital banking trends. This variation highlights the importance of analysing each bank’s revenue drivers rather than viewing the sector as a single theme.
Analysts often examine capital strength, earnings resilience, credit quality, valuation, and cost discipline when assessing bank performance. During earnings season, changes in net interest income, loan-loss provisions, capital ratios, and management guidance may provide a clearer view of how each institution is positioned within the changing macroeconomic and regulatory environment.
Frequently asked questions
Why are bank stocks falling?
Bank stocks can fall for several reasons depending on the macro environment. Common causes include expectations of interest rate cuts (which compress net interest margins), rising loan default rates, weak earnings guidance, or broader risk-off sentiment.
Regulatory headwinds — such as higher capital requirements under Basel III — can also weigh on valuations if they constrain dividends or buybacks. In 2026 specifically, the sector faces a mixed backdrop: rate normalisation supports some income streams while slower loan growth and geopolitical uncertainty create headwinds for others.
What key metrics should you use to evaluate bank stocks?
Analysts typically use a distinct set of metrics when assessing bank stocks. Net interest margin (NIM) measures the spread between what a bank earns on loans and what it pays on deposits. Return on equity (ROE) and return on tangible common equity (ROTCE) reflect capital efficiency.
The price-to-book (P/B) ratio is commonly used for valuation. The efficiency ratio (operating costs as a percentage of revenue) signals cost discipline. Finally, the common equity tier 1 (CET1) ratio is a key regulatory capital measure indicating financial resilience. Monitoring these across reporting periods helps build a clearer picture of a bank’s underlying performance trend.
What are the main factors driving bank stocks in 2026?
Several structural and cyclical forces are shaping banking sector performance in 2026. Interest rate normalisation remains a central theme — as the Federal Reserve holds rates at elevated levels, banks must navigate the impact on deposit costs and loan demand. Capital markets activity, particularly in M&A, equity issuance, and debt refinancing, is another key driver for investment banking-focused institutions.
Regulatory changes under Basel III are influencing how banks allocate capital. Finally, AI adoption is increasingly treated as a competitive differentiator, with JPMorgan Chase ranking first on the Evident AI Index for the fourth consecutive year in 2025.
How do interest rates affect bank stocks?
Interest rates have a direct and significant impact on bank profitability. When rates are rising or elevated, banks can earn more on their loan portfolios and fixed-income holdings than they pay on deposits, widening the net interest margin and supporting net interest income.
Conversely, when rates fall, margins can compress if deposit costs do not decline as quickly as loan yields. Higher rates can also slow borrowing activity, reduce mortgage originations, and increase credit risk if borrowers struggle to service debt. For capital-markets-oriented banks, rate changes influence deal timing and investor risk appetite. The relationship is not uniform — business mix, liability structure, and hedging strategies all shape how individual institutions respond.
Which US bank stocks are in focus for 2026?
This article covers five US-listed banking institutions representing different segments of the sector.
- JPMorgan Chase (JPM) is the largest US bank by assets, with broad diversification across consumer banking, investment banking, and asset management.
- Bank of America (BAC) is closely tied to consumer credit trends and net interest income, making it sensitive to rate and loan growth dynamics.
- Morgan Stanley (MS) is weighted towards wealth management and capital markets, with recurring fee income from its large asset base.
- Goldman Sachs (GS) is heavily oriented towards investment banking, trading, and institutional activity, with performance linked to deal volumes and market conditions.
- SoFi Technologies (SOFI) represents the digital banking segment, operating a mobile-first platform spanning lending, banking, and investing — a different risk and growth profile from legacy institutions.
Traders looking to gain exposure to bank share price movements may do so through derivative products such as CFDs, where available, subject to local jurisdictional restrictions. This content is not directed at residents of jurisdictions where such products are restricted or prohibited.
RISK WARNING: CFDs are complex financial instruments and carry a high risk of losing money rapidly due to leverage. You should ensure you fully understand the risks involved and carefully consider whether you can afford to take the high risk of losing your money before trading.
Disclaimer: The information is provided for educational purposes only and doesn’t take into account your personal objectives, financial circumstances, or needs. It does not constitute investment advice. We encourage you to seek independent advice if necessary. The information has not been prepared in accordance with legal requirements designed to promote the independence of investment research. No representation or warranty is given as to the accuracy or completeness of any information contained within. This material may contain historical or past performance figures and should not be relied on. Furthermore estimates, forward-looking statements, and forecasts cannot be guaranteed. The information on this site and the products and services offered are not intended for distribution to any person in any country or jurisdiction where such distribution or use would be contrary to local law or regulation.
References
- “About Us – J.P. Morgan Asset Management” https://am.jpmorgan.com/us/en/asset-management/adv/about-us/ Accessed 8 Jun 2026
- “JPMorganChase continues to lead the world’s top banks in AI maturity – JP Morgan Chase” https://www.jpmorganchase.com/about/technology/news/jpmc-evident-25 Accessed 8 Jun 2026
- “2026 Year-Ahead Investment Outlook – JP Morgan Asset Management” https://am.jpmorgan.com/content/dam/jpm-am-aem/global/en/2026%20Year-Ahead%20Investment%20Outlook.pdf Accessed 8 Jun 2026
- “Bank of America Fast Facts – Bank of America” https://newsroom.bankofamerica.com/content/newsroom/company-overview/bank-of-america-fast-facts.html Accessed 8 Jun 2026
- “Bank of America Q1 2026 Earnings Call Summary – Yahoo Finance” https://finance.yahoo.com/markets/stocks/articles/bank-america-corporation-q1-2026-164656806.html Accessed 8 Jun 2026
- “Bank of America Q1 2026 Earnings: Consumer & Wealth Management Show Divergent Strength – ainvest” https://www.ainvest.com/news/bank-america-q1-2026-consumer-wealth-management-show-divergent-strength-2604/ Accessed 8 Jun 2026
- “Morgan Stanley Q1 2026 Earnings Transcript – The Motley Fool” https://www.fool.com/earnings/call-transcripts/2026/04/15/morgan-stanley-ms-q1-2026-earnings-transcript/ Accessed 8 Jun 2026
- “About Us – Morgan Stanley Investment Management” https://www.morganstanley.com/im/en-us/capital-seeker/about-us/our-business.html Accessed 8 Jun 2026
- “Goldman Sachs reports record $3.65 trillion in assets under supervision – Goldman Sachs Q1 2026 Earnings” https://www.goldmansachs.com/pressroom/press-releases/current/pdfs/2026-q1-earnings-results-presentation.pdf Accessed 8 Jun 2026
- “Investment Outlook 2026 – Goldman Sachs” https://am.gs.com/en-sg/institutions/insights/article/investment-outlook Accessed 8 Jun 2026
- “SoFi Reports First Quarter 2026 with Record Net Revenue of $1.1 Billion, Record Member and Product Growth – SoFi Technologies” https://investors.sofi.com/news/news-details/2026/SoFi-Reports-First-Quarter-2026-with-Record-Net-Revenue-of-1-1-Billion-Record-Member-and-Product-Growth-Net-Income-of-167-Million/default.aspx Accessed 8 Jun 2026
- “The 2026 Outlook – SoFi Technologies” https://www.sofi.com/article/investment-strategy/the-2026-outlook/ Accessed 8 Jun 2026