The Elliott Wave Theory is a method for mapping market crowd behaviour. It’s a form of technical analysis that focuses on recurring price patterns in financial markets.
At its core, the Elliott Wave Theory says that markets trend in waves. In simple terms, waves move with the crowd, then push back. That push and pull creates a repeatable wave structure. These price patterns can help traders assess risk and direction.
In this article, you will learn in minute detail about the Elliot Wave Theory, its history, principles and rules, how to trade it, common mistakes as well as solutions.
The Origins of the Elliott Wave Theory
Ralph Nelson Elliott first developed the Elliott Wave Theory. One interesting fact: Many traders later shortened his name to “Nelson Elliott”.
He studied market charts and then published his theory for broader use in the late 1930s. It gained wider attention after his book and market letters reached a larger audience of traders.
Over time, wave analysts developed clearer rules and guidelines to improve wave count accuracy. These rules helped traders determine when a wave count is valid and when it should be rejected.
As markets evolved, Elliott Wave Theory spread beyond stocks into currencies, commodities, and indices. Groups such as Elliott Wave International [1] helped standardise terminology and promote consistent methods for applying the Elliott Wave.
Over time, the Elliott Wave Theory evolved into a comprehensive analytical framework. Today, many traders still use it as a tool for forecasting market movements, planning trades, and improving decision-making, often alongside other technical indicators.
Related Article: Guide To Technical Indicators: Types And Which To Use
The Principles of Elliot Wave Pattern: Impulse and Correction
Some technical analysts apply Elliott’s theory to study market behaviour and price patterns. The principles of the Elliott Wave split markets into two phases: Impulse waves and corrective waves.
- An impulse wave moves in the direction of the main trend.
- A corrective wave is a pause that moves against the trend.
This is why Elliott Wave Theory works well on trending markets. First, you define the direction of the trend. Then, you determine whether the price is following the main trend or correcting against it.
Read More: Trend Analysis Complete Guide: How to Use It
The 2 Elliott Wave Patterns You Must Know
Most charts can be simplified into two repeating forms. These two Elliott Wave patterns appear across markets and timeframes.
1. The Impulse: 5 Waves
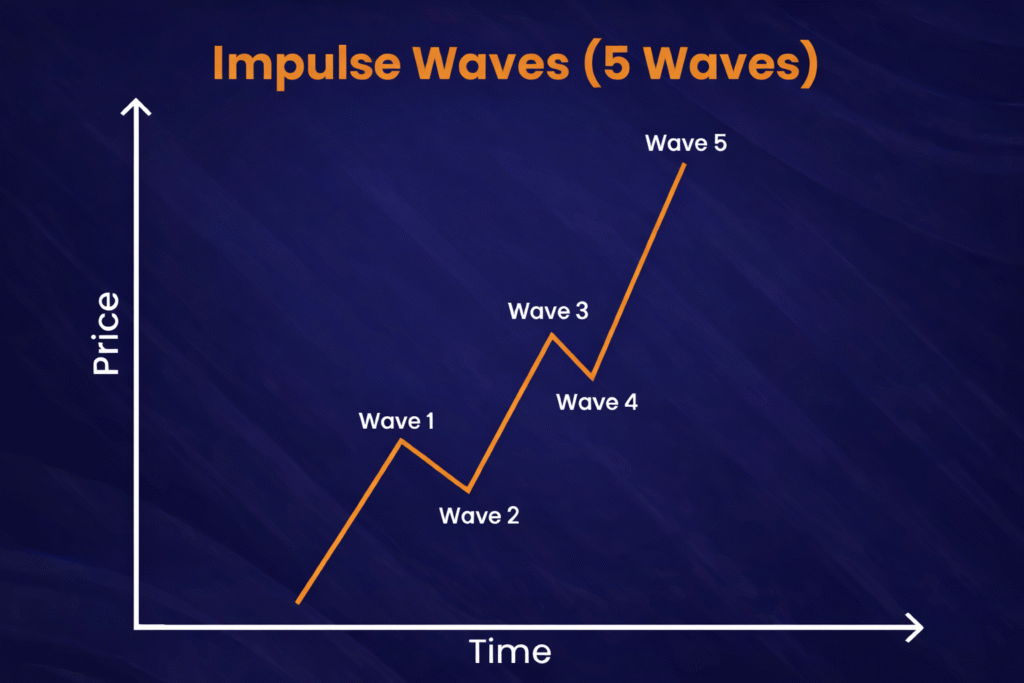
An impulse wave refers to upward movements in an uptrend or downward movements in a downtrend. One notable feature of these waves is that they can persist for long periods, be it hours, years, or even decades.
For those who are new to the Elliott Wave Theory, an impulse is a five-part move in the direction of the trend. Each part plays a role in the overall price structure:
- Wave 1: The first wave starts the new move.
- Wave 2: The second wave is a pullback that tests conviction.
- Wave 3: The third wave produces the strongest push, often with volume.
- Wave 4: In the fourth wave, a pause typically occurs, often sideways and complex.
- Wave 5: The fifth and last wave is the final push before a larger correction happens.
A key point is that impulses are always subdivided into smaller waves. This is why the Elliott Wave Theory is often called a fractal system of fractal patterns.
2. The Correction: 3 Waves
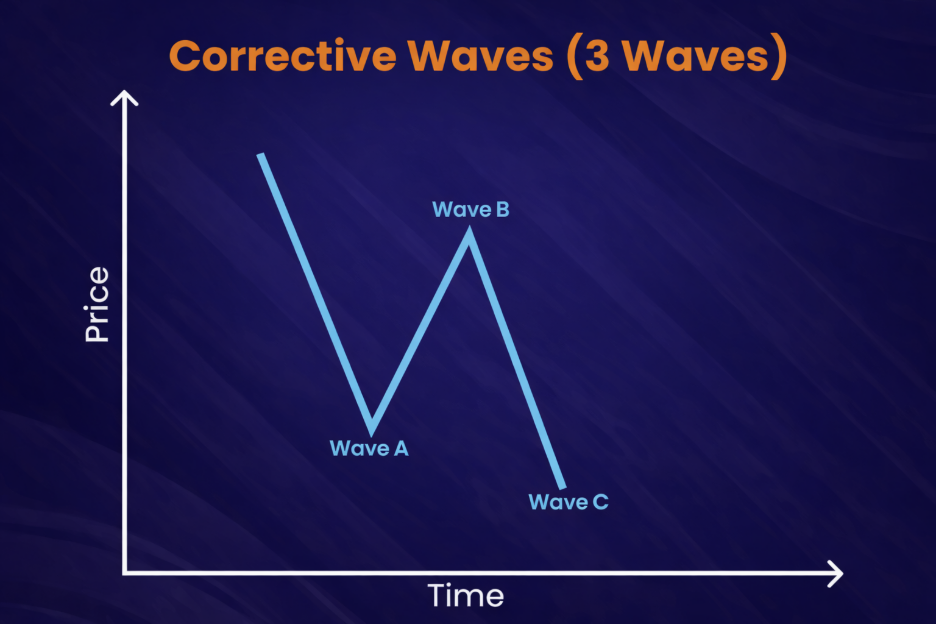
In the Elliott Wave Theory, a correction consists of three waves that often take the form of a simple A-B-C structure. This A-B-C formation represents the classic three-wave diagonal pattern.
This is the common corrective structure that appears after a strong trend push. In Elliott Wave Theory, corrective waves also subdivide into smaller waves. This is why accurate wave labelling requires patience and clearly defined swing points.
The Defined Rules of Impulse Waves: What Cannot Be Broken
When it comes to impulse waves, the Elliott Wave Theory is not ‘draw-anything’ chart art. Instead, it has defined rules that keep wave counts disciplined. Here are some of the most commonly used Elliott Wave rules for impulse waves:
Rule 1: Wave 2 Cannot Retrace 100% of Wave 1
Wave 2 can retrace Wave 1, but not completely. If Wave 2 breaks below the start of Wave 1, the wave count is considered invalid.
This rule matters because many traders chase early entries. They assume Wave 1 marks the breakout, but the move often retraces and stops them out. A clean Wave 2 pullback can provide a better risk setup.
Rule 2: Wave 3 Is Never the Shortest Among 1, 3, and 5
Wave 3 is usually the most powerful and often the largest and clearest move in the sequence. This is why traders pay close attention to the relationship between Waves 1 and 3.
You often see this sequence unfold in real time. First, Wave 1 begins gaining traction and attracts early participants. Then Wave 3 develops as broader market participation increases. It’s often driven by catalysts such as news, economic reports, or shifts in market sentiment.
Rule 3: Wave 4 Cannot Overlap Wave 1 in a Standard Impulse
Wave 4 is another corrective wave within the impulse structure. It represents a pause rather than a reset back into the territory of Wave 1. It’s also typically less intense than Wave 2. Many wave counts fail at this stage, especially in choppy market conditions.
A simple reminder helps many traders: Waves 2 and 4 are corrective moves against the trend, while Waves 1, 3, and 5 move in the direction of the trend. Wave 4 also tends to produce smaller retracements when Wave 3 is extended.
Elliot Wave Practical Guidelines
Elliott Wave works best when you keep it simple. Many traders fail because they over-label every swing. Instead of predicting every tick, identify a clean wave structure and manage risk:
- Start With the Larger Trend: Look at the higher timeframe first. If the direction of the trend is up, focus mainly on the five-wave impulse. If the trend is down, look for the bearish version. A good wave count should feel ‘obvious’, not forced.
- Use the Rules Before the Guidelines: If a count breaks a core rule, drop it quickly. Respect what the chart is showing—Elliott Wave is an analysis tool, not a belief system.
- Respect the Wave Degree: A five-wave move on the 15-minute chart can sit inside a correction on the 4-hour chart. This is why traders get trapped. They think Wave 5 is the top, but it may only be a lower-degree wave.
- Alternation Between Waves 2 and 4: In a five-wave pattern, expect Wave 2 and Wave 4 to show alternate patterns. This is known as the Elliott Wave Alternation Principle [2]. If Wave 2 is sharp and deep, Wave 4 is often sideways and slower. If Wave 2 is mild, Wave 4 may surprise you with a stronger pullback. This guideline alone can improve trading decisions.
- Don’t Chase Wave 5: Wave 3 is usually the clearest opportunity. By Wave 5, momentum often fades and risk rises. For traders considering Wave 5, it’s best to reduce position size and tighten invalidation levels.
- Use Technical Indicators as Support, Not As Proof: Momentum tools can help confirm Wave 3’s strength or warn of Wave 5’s exhaustion. However, price patterns should come first.
Finally, always keep an alternate count. Markets change quickly, and flexibility helps traders adapt.
Wave Degree and Lower-Degree Waves
The Elliott Wave Theory only works if traders respect the timeframe context. That context is called wave degree.
A daily chart can contain a full five-wave impulse. Inside it, traders may find lower-degree waves on the four-hour chart. Those lower-degree waves must also follow the same core logic.
This is where traders often get trapped. Some may label small noise as Wave 5 too soon, and then a larger correction invalidates the idea.
When the Pattern Reverses
Trends can reverse, and Elliott Wave offers a clear way to frame them. After a top, the bearish structure often mirrors the bullish one.
You may hear traders say the pattern has reversed into five waves down. This typically means a five-wave decline followed by an A-B-C corrective bounce.
Corrections, Counter-Trend Impulses, and Complex Moves
Not all counter-trend moves form a simple A-B-C correction. Sometimes the market produces a sharp five-wave drop against a larger uptrend.
This represents a five-wave counter-trend impulse on a smaller degree. It often appears during risk-off bursts or liquidation waves. These moves can still be tradable, but they usually require tighter risk control.
Related Article: 10 Risk Management Techniques to Use in Trading Now
Diagonals and Overlap Exceptions (Where Rule 3 Changes)
In a standard impulse wave, Rule 3 is strict: Wave 4 cannot overlap Wave 1 price territory. This rule helps keep the wave structure clean and trending.
However, markets do not always move in a textbook way. This is where diagonal patterns matter because diagonals are the main exception to the overlap rule.
What Is a Diagonal in the Elliott Wave Theory?
A diagonal is a wedge-shaped impulse pattern. Price continues moving in the trend direction, but with overlap and weaker follow-through. The swings often look like a tightening range, with converging trendlines.
In diagonal structures, Wave 4 can overlap Wave 1. That is the key exception to Rule 3.
The Two Main Types of Diagonals in Elliott Wave
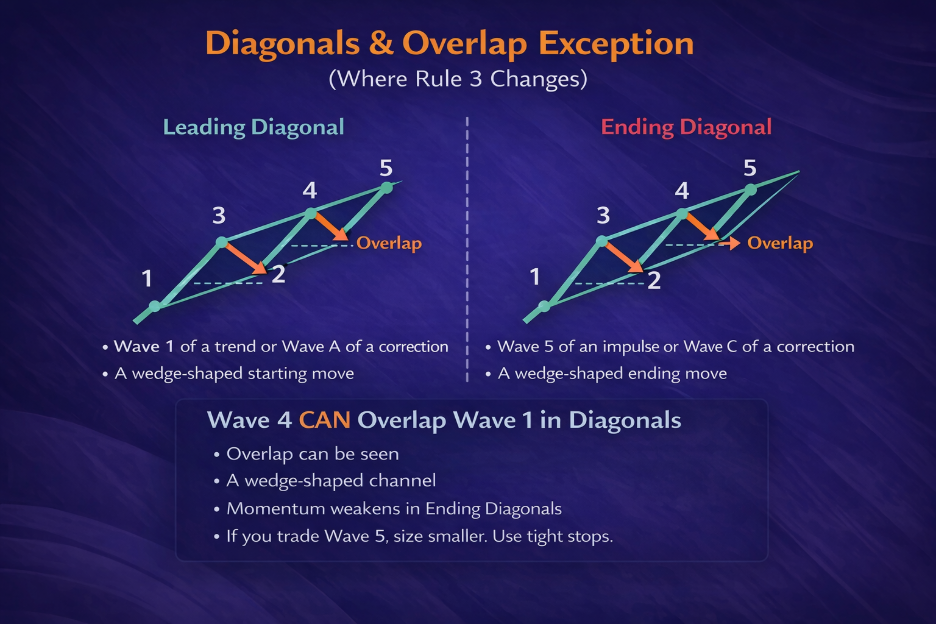
1. Leading Diagonal
This can appear in Wave 1 of a new trend or in Wave A of a correction. It often forms when a new move begins, but conviction is still developing. Price pushes forward, then pulls back deeply, creating overlap between the waves.
2. Ending Diagonal
This usually appears in Wave 5 of an impulse or Wave C of a correction. It tends to form near the end of a move when momentum begins to fade. Traders may observe slowing price movement, choppy advances, and frequent pullbacks.
How Diagonals Are Built
Diagonals still follow a five-wave structure (1-2-3-4-5), but their internal wave patterns differ from a standard impulse. The legs often resemble smaller three-wave moves rather than strong five-wave pushes.
This is why diagonals often appear more irregular or ‘messy’ compared with strong trending waves.
How to Spot a Diagonal in Real Time
To identify a developing diagonal pattern in real time, traders often look out for these common characteristics:
- Overlap between Wave 4 and Wave 1
- A wedge-shaped or narrowing channel
- Slower price progress with deeper pullbacks
- Momentum divergence, especially in ending diagonals
Take note that in live market conditions, diagonals can be harder to recognise than standard impulse waves because the structure often appears choppy and overlapping.
Why Diagonals Matter for Traders
Diagonal patterns often signal market transitions.
- A leading diagonal may indicate the early stage of a new trend, though volatility may remain high.
- An ending diagonal often suggests the current move is losing momentum and a reversal or sharp correction could follow.
Traders may study invalidation levels and leverage concepts for educational purposes when analysing such patterns.
How Elliott Wave Theory May Be Applied in Analysis
Many traders ask how Elliott Wave Theory may be applied in market analysis. The best approach is to start simple and focus on repeatable setups.
Educational Example 1:
Analysts often observe the Wave 2 pullback relative to Wave 1’s high to study how retracements develop within the Elliott Wave framework. This helps illustrate how wave rules may be applied in analysis, rather than serving as a recommendation to trade.
Educational Example 2:
Wave 3 often demonstrates a strong trend segment. Observing its behaviour can help analysts understand how strong trends develop within the Elliott Wave structure.
Educational Example 3:
Wave 5 may display momentum changes. Studying this stage can help highlight how trend exhaustion may appear as a move approaches completion.
Note: These examples are for educational purposes only.
Common Mistakes in Elliott Wave Analysis (And How to Avoid Them)
Most Elliott Wave mistakes occur when traders try to force the chart to match a preconceived narrative. The best way to improve is to keep your process disciplined and your labels simple.
- Forcing a wave count to fit a bias: If a trader ‘needs’ the market to be in Wave 3, they will eventually find a way to label it that way. Avoid this by defining invalidation levels first. If a core rule is broken, the wave count should be discarded.
- Counting every small price movement: Over-labeling turns market noise into artificial structure. Avoid this by starting on a higher timeframe and marking only clear swing highs and lows.
- Ignoring wave degree: A five-wave move on a small timeframe can still sit inside a larger correction. Avoid this by reviewing one or two timeframes above your primary trading chart.
- Breaking core rules but keeping the count: Some traders treat Elliott Wave rules like flexible guidelines, which can reduce analytical accuracy. Avoid this by memorising and applying the three impulse rules first.
- Misreading corrections: Corrective waves are often messy, overlapping, and slow. Avoid rushing to label them. Instead, wait for a clearer A-B-C structure to develop.
- Chasing wave 5 moves: Wave 5 can appear attractive but often forms with weaker momentum. Many analysts prefer to focus on Wave 3 opportunities, while studying Wave 5 mainly to observe how trends begin to weaken.
- Allowing indicators to override price structure: Indicators may lag during strong trends. Avoid this by letting price patterns and wave rules guide the analysis, using indicators only as supporting tools.
- Not keeping an alternate count: Markets can shift quickly, and a primary wave count may fail. Avoid this by maintaining an alternate scenario with its own invalidation level helps traders remain flexible.
If traders keep the rules strict, analyse higher timeframes first, and avoid forcing labels, Elliott Wave analysis can become far more useful.
Elliott Wave in Modern Market Analysis
Some trading desks now attempt to test wave logic with algorithmic models and pattern-scanning tools. These systems can help identify repeating structures across large datasets.
However, Elliott Wave labelling can involve a degree of interpretation and contextual judgment. Due to how machines struggle with subjective labelling, human analysts still play an important role when applying the framework.
Tools and Indicators That Pair Well With Elliott Wave Analysis
Elliott Wave is primarily a price-based analytical framework, but it can work well alongside a few supporting tools. The purpose of these tools is not to ‘prove’ a wave count, but to help confirm trend strength, spot weak spots, and set clear risk levels.
Trend Indicators
A basic moving average can help analysts stay aligned with the broader trend. If price holds above a rising average, the impulse scenario may carry more weight. If the price keeps falling below a declining average, the bearish count may appear stronger.
Trendlines and channels can also be useful. During a clear impulse wave, the price often respects a channel. When price breaks the channel late in a move, it can hint that Wave 5 is approaching completion.
Momentum Indicators
Momentum indicators such as Relative Strength Index (RSI) and Moving Average Convergence Divergence (MACD) are commonly used.
During Wave 3, momentum often expands and stays firm even for smaller pullbacks. By contrast, Wave 5 may display momentum divergence, where price reaches a new high but the indicator fails to confirm the move. This divergence can indicate weakening momentum and a higher probability of a corrective phase.
Volume Analysis
In many markets, Wave 3 attracts the strongest participation. Rising trading volume during this stage can support the wave structure.
By contrast, declining or weaker volume during Wave 5 may indicate that the trend is losing strength and that the move could be nearing completion.
Fibonacci Tools
Fibonacci tools are widely used alongside Elliott Wave analysis. Retracement levels are often applied to estimate Wave 2 and Wave 4 pullbacks, while Fibonacci extensions may be used to project potential Waves 3 and 5 targets.
Although Fibonacci levels are not predictive on their own, they can help analysts structure entries, targets, and invalidation levels more systematically.
Related Article: Fibonacci Retracement in Trading: A Comprehensive Guide
Market Structure
Key support and resistance zones, prior swing highs and lows, and break-of-structure levels help keep wave counts grounded in observable price action. If a wave count ignores major market structure levels, the analysis is often less reliable.
Used together, these tools don’t replace Elliott Wave analysis. Instead, they can help make the structure clearer and support more disciplined market analysis.
FAQs
Q: What is Elliott Wave Theory?
A: Elliott Wave Theory is a technical analysis framework that suggests market prices move in repeating ‘waves’ influenced by crowd psychology. These movements are typically observed as a five-wave pattern in the direction of the main trend, followed by a three-wave correction, repeating across different timeframes.
Q: What are the commonly used trading platforms that support Elliott Wave analysis?
A: Trading platforms such as MetaTrader 4 (MT4) and MetaTrader 5 (MT5) provide charting tools and indicators that can support Elliott Wave analysis. Many platforms also allow custom scripts and indicators across web and mobile interfaces.
Q: How do top investment apps incorporate Elliott Wave indicators?
A: Most apps incorporate Elliott Wave tools through chart features and add-ons, such as built-in wave drawing tools, or plug-in indicators that automatically label waves using swing points (often based on zigzag-style logic). Some platforms also include auto-Fibonacci zones, alerts, and pattern invalidation levels to help users identify potential wave breaks more quickly.
RISK WARNING: CFDs are complex financial instruments and carry a high risk of losing money rapidly due to leverage. You should ensure you fully understand the risks involved and carefully consider whether you can afford to take the high risk of losing your money before trading.
Disclaimer: The information is provided for educational purposes only and doesn’t take into account your personal objectives, financial circumstances, or needs. It does not constitute investment advice. We encourage you to seek independent advice if necessary. The information has not been prepared in accordance with legal requirements designed to promote the independence of investment research. No representation or warranty is given as to the accuracy or completeness of any information contained within. This material may contain historical or past performance figures and should not be relied on as an indicator of future performance. Furthermore, estimates, forward-looking statements, and forecasts cannot be guaranteed. The information on this site and the products and services offered are not intended for distribution to any person in any country or jurisdiction where such distribution or use would be contrary to local law or regulation.
- “Fractal Market Forecasting – Elliott Wave International” https://www.elliottwave.com/. Accessed on 5 March 2026.
- “Alternation – Elliott Wave International” https://www.elliottwave.com/waveopedia/alternation/. Accessed on 5 March 2026.