


[DAILY TRADING] XAUUSD Analysis 20 July 2026 – Gold Holds the $4,000 Line as Iran Risk Meets a Cautious Fed
 Updated Updated Tue, 2026 July 21 03:09
![[DAILY TRADING] XAUUSD Analysis 20 July 2026 – Gold Holds the $4,000 Line as Iran Risk Meets a Cautious Fed](/wp-content/themes/vantage/images/academy-post-default-img.webp)
Gold remains range-bound despite a volatile macro backdrop. XAUUSD is trading near $4,005 as of 07:40 (GMT+8) / 23:40 UTC on 19 July 2026, per the Vantage XAUUSD CFD feed, barely budging despite a week that gave it every reason to move.
Last week’s gold price news was anything but quiet: gold posted its steepest weekly decline in six months, then clawed most of it back within days [1]. Two forces are arm-wrestling over XAUUSD price: an escalating Middle East conflict propping up safe-haven demand, and a Fed expected to hold steady at its 28-29 July meeting.
Key Points
- Gold has held above the $4,000 handle through the Asian morning session on 20 July 2026, after touching its lowest level since 1 July during last week’s sell-off.[1]
- The Middle East conflict between the US and Iran continued into a second week, keeping oil prices elevated and complicating the inflation picture alongside incoming US economic data that policymakers will assess ahead of the 28-29 July meeting.[2]
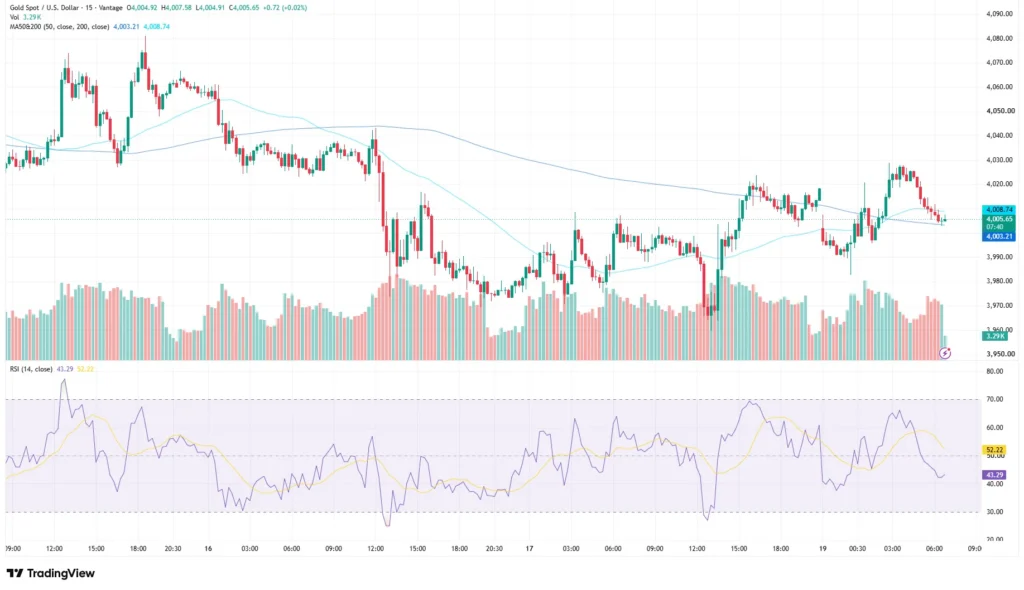
- On the 15-minute XAUUSD TradingView chart, price is squeezed between its 50-period and 200-period moving averages, with the Relative Strength Index sitting in the lower half of its range.
What the chart is showing
Vantage’s XAUUSD CFD opened the most recent 15-minute bar at $4,004.92, ran between a high of $4,007.58 and a low of $4,004.91, and closed at $4,005.65, up $0.72 (+0.02%) as of the cut-off above. Zoom out, and the gold price today tells a rangier story: price fell sharply from the mid-$4,060s toward a swing low near $3,955 around 17 July, then recovered into a band between $3,995 and $4,030 through the weekend gap and into Monday’s Asian session.
For anyone running their own XAUUSD technical analysis, the 15-minute chart shows the 50-period moving average at $4,003.21, just below the 200-period moving average at $4,008.74, per the TradingView setup used for this analysis. Price sits almost exactly between the two, chart-speak for indecision. RSI (14, close) reads 43.29, with its moving-average overlay at 52.22, both in the lower half of the range, per the same setup. Volume printed 3.29K on the bar, consistent with the quieter early Asian session.
The Middle East conflict keeps a floor under prices

The US-Iran conflict extended into a second week, with the US carrying out further strikes against Iran-linked targets and President Trump saying Washington could broaden action against the country’s infrastructure absent a diplomatic breakthrough [2]. Oil prices remained elevated amid the geopolitical uncertainty, and Washington also floated measures affecting shipping conditions around the Strait of Hormuz, adding to the uncertainty over energy costs [3].
That is the odd part of this week’s gold price news: geopolitical risk has offered safe-haven support, but energy-driven inflation has reinforced expectations that the Fed stays cautious, capping the metal’s upside. Gold touched its lowest level since 1 July during Friday’s session before recovering into the close, on track for its steepest weekly decline in six months as the conflict lifted oil prices and firmed the case for higher-for-longer rates [1].
The Fed decision traders are watching
The Federal Reserve‘s next meeting runs 28-29 July 2026. Markets have mostly priced this as a likely hold, though CME FedWatch pricing showed rate-hike odds climbing sharply mid-week as oil prices jumped on the conflict news, before easing back [3].
Separately, June headline CPI and PPI came in on the softer side, helped in part by lower energy costs, though import prices unexpectedly rose, a sign underlying price pressures have not fully eased [2]. That mixed picture leaves the Fed a narrower path, the kind of setup that keeps gold prices rangebound rather than trending cleanly.
Levels to watch this week
The table below covers the zones traders are monitoring on XAUUSD. These are reference levels, not trade signals.
| Pair | Support | Resistance | What’s happening |
| XAUUSD | $3,995 / $3,955 | $4,030 / $4,060 | Squeezed between the 50-period and 200-period moving averages on the 15-minute chart |
Table 1: Key levels as of 07:40 (GMT+8) / 23:40 UTC, 19 July 2026. Sources: Vantage XAUUSD CFD, TradingView. Indicative only.
- FOMC Rate Decision, 29 July: The Fed’s policy statement and press conference, the main catalyst for the week.
- Weekly Jobless Claims, 23 July: A read on labour-market conditions ahead of the Fed decision.
- Manufacturing and Services PMI, 24 July: July flash prints covering both sectors, released just before the FOMC meeting.
Gold’s swings between roughly $3,995 and the low $4,030s over the past few sessions show how quickly this range can move on a single Middle East headline. Market participants often monitor Stop Loss placement around levels like these, which limits losses to a planned size rather than removing risk altogether. With support and resistance close together, session volatility has been capable of testing both sides of the range within a single day.
Leverage works both ways in this headline-driven market, magnifying gains and losses alike. Position sizing relative to account equity is worth revisiting ahead of the Fed decision, for traders holding exposure across gold, oil, and the US dollar.
For background on the tools above, the Vantage Academy covers gold trading techniques, tips for trading gold, a XAUUSD strategy guide, gold risk management, and reading gold charts on TradingView. See also the Nikkei 225 daily analysis from 17 July 2026.
RISK WARNING: CFDs are complex financial instruments and carry a high risk of losing money rapidly due to leverage. You should ensure you fully understand the risks involved and carefully consider whether you can afford to take the high risk of losing your money before trading.
Disclaimer: The information is provided for educational purposes only and doesn’t take into account your personal objectives, financial circumstances, or needs. It does not constitute investment advice. We encourage you to seek independent advice if necessary. The information has not been prepared in accordance with legal requirements designed to promote the independence of investment research. No representation or warranty is given as to the accuracy or completeness of any information contained within. This material may contain historical or past performance figures and should not be relied on. Furthermore estimates, forward-looking statements, and forecasts cannot be guaranteed. The information on this site and the products and services offered are not intended for distribution to any person in any country or jurisdiction where such distribution or use would be contrary to local law or regulation.
References
[1] “Gold heads for biggest weekly loss in six as Middle East war fans inflation worries – CNBC” https://www.cnbc.com/amp/2026/07/17/gold-on-track-for-biggest-weekly-loss-in-six-as-iran-war-fans-inflation-worries.html Accessed on 20 July 2026.
[2] “Gold – Price – Chart – Historical Data – News – Trading Economics” https://tradingeconomics.com/commodity/gold Accessed on 20 July 2026.
[3] “A July rate hike from the Fed? The odds are rising – CNBC” https://www.cnbc.com/2026/07/13/-a-july-rate-hike-from-the-fed-the-odds-are-rising.html Accessed on 20 July 2026.