[DAILY TRADING] S&P 500 Analysis 29 June 2026 – Tech Rotation Hits 7,406 Before NFP Week
Vantage Editorial Team >
Vantage Editorial Team >
Vantage is a global, multi-asset broker with a team of in-house writers and market analysts who produce educational and insightful trading content for traders of all levels.
![[DAILY TRADING] S&P 500 Analysis 29 June 2026 – Tech Rotation Hits 7,406 Before NFP Week](https://www.vantagemarketsea.com/wp-content/uploads/2026/06/SP500_banner_900x430_balanced_optimized-2.webp)
The Vantage SP500 CFD was trading near 7,406.50 as of 10:00 (UTC) / 18:00 (GMT+8) on 29 June 2026. The S&P 500 index enters the final session of Q2 carrying a near-2% weekly loss, driven by five straight days of Nasdaq underperformance and a rotation out of mega-cap technology into healthcare, industrials, and small caps.[1]
The week ahead is the most data-heavy of the month. June nonfarm payrolls (NFP) land on 2 July, with JOLTS, ADP employment, and ISM Manufacturing all preceding it. Today’s S&P 500 news calendar is light.
All prices are from the TradingView chart above as of 10:00 (UTC). This is not financial advice.
Key Points
- The Vantage SP500 CFD held near 7,406.50, above the MA50 (7,382.94) and MA200 (7,394.30) on the 15-minute chart as of 10:00 (UTC), recovering from a session low around 7,300 on 26 June.
- Investors rotated away from AI infrastructure names amid concerns over elevated capital expenditure and slower monetisation timelines; six of 11 S&P 500 sectors still gained on Thursday with industrials leading, reflecting a rotation rather than a market-wide decline.[1]
- May NFP came in at 172,000 against an 85,000 consensus; June payrolls on 2 July 2026 are the next major macro test for the S&P 500 index.[3]
What the SP500 chart is showing
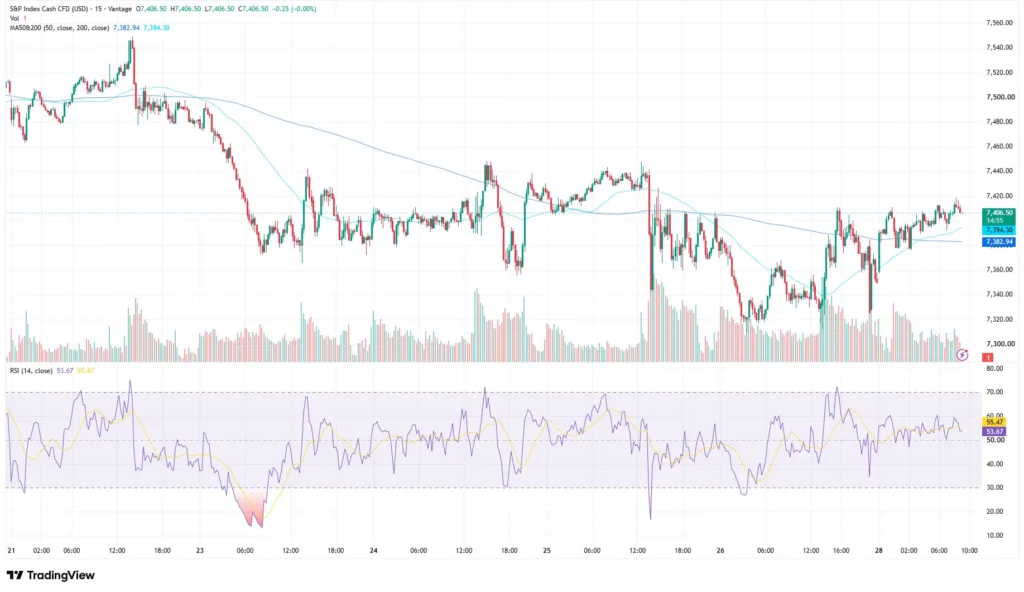
The S&P 500 index opened the week near 7,520 on the SP500 chart, then sold off sharply through 23-25 June 2026 before hitting a low around the 7,300 area on 26 June 2026. The recovery since has been steady rather than sharp, while remaining within the broader corrective structure, with price working back above the MA50 at 7,382.94 and the MA200 at 7,394.30 on the 15-minute chart. Both MAs are converging, and price at 7,406.50 is sitting just above them, which reflects the tentative nature of the rebound.[4]
The RSI (14) per the TradingView setup used for this analysis reads 53.67, with the signal at 55.47. Both sit in mid-range, showing no overbought or oversold signal at current S&P 500 price levels. The deepest RSI reading of the week came during the 23 June 2026 selloff, where it briefly dipped toward the 20 zone. Volume on the Vantage CFD feed spiked during the 25-26 June 2026 decline, consistent with quarter-end rebalancing flows, and has since moderated.
S&P 500 news today: AI costs, rotation, and the Fed

The S&P 500 fell nearly 2% on the week while the Nasdaq dropped 4.6%.[1] Investors continued rotating away from AI infrastructure names amid concerns over elevated capital expenditure and slower monetisation timelines. Goldman Sachs Research has raised its S&P 500 year-end 2026 forecast to 8,000, projecting AI-related investment will account for roughly half of S&P 500 earnings growth this year.[5] The current tech selling reflects the market demanding a clearer cash-return timeline from AI infrastructure spending, not a rejection of the structural thesis.
Sector rotation has been the cleaner read. Six of 11 sectors gained on Thursday, with industrials up 2.19% and healthcare up 1.49%.[1] The S&P 500 Equal Weight Index outpaced the cap-weighted index on the week, a sign that broader market participation is improving even as the mega-cap names struggled.[6]
On the Fed side, markets modestly reduced expectations for additional tightening following lower energy prices and softer near-term inflation expectations. WTI settled near $69 per barrel, down nearly 10% on the week.[6]
Key levels on the S&P 500 index
The table below covers reference zones on the Vantage SP500 CFD as of 29 June 2026, 10:00 (UTC). These are not trade signals.
| Zone | Support | Resistance | What traders are watching |
| Near-term | 7,300 / 7,354 | 7,440 / 7,500 | 50-day daily MA (~7,356) has held for three consecutive sessions; daily close below that line would shift attention |
| MAs (15-min) | MA50: 7,382.94 | MA200: 7,394.30 | Price at 7,406.50 sits above both MAs on the SP500 chart as of 10:00 (UTC) |
Table 1: S&P 500 index key levels as of 29 June 2026, 10:00 (UTC) / 18:00 (GMT+8). Sources: TradingView, CNBC, Schwab. Indicative only.
The daily 50-day MA near 7,356 has been the key line to watch. The S&P 500 index closed above it for three consecutive sessions even as it threatened to break, and a sustained settlement below that level would attract attention.[6] The 7,440-7,500 area is where sellers appeared mid-week; the 7,300 zone, where the week’s low was set, is the wider support reference.
What to watch
- Consumer Confidence, 30 June 2026: June reading. A further decline from depressed levels could reinforce the rotation-away-from-risk theme.
- JOLTS Job Openings, 30 June 2026: May openings. Tracks labour demand alongside the NFP series.
- ADP Employment, 1 July 2026: June private payrolls. Early read on Friday’s NFP.
- ISM Manufacturing PMI, 1 July 2026: June reading. A contraction would weigh on the industrials sector that led rotation this week.
- Nonfarm Payrolls (NFP), 2 July 2026: June jobs report. May came in at 172,000 versus an 85,000 consensus. A strong print keeps the Fed on hold; a miss reopens rate cut discussion.[3]
- Strait of Hormuz, Ongoing: Continued developments around the Strait of Hormuz remain a key risk for energy markets and S&P 500 risk sentiment. Any fresh escalation or de-escalation signal could move oil prices quickly.[1]
See all SP500 news here.
Market participants often monitor Stop Loss placement relative to the 7,382-7,395 MA cluster on the 15-minute S&P 500 CFD chart, with the 7,300 session low as the wider reference. Given the speed of this week’s swings and the volume of data ahead, intraday range assumptions carry more uncertainty than usual. Combined exposure across technology CFDs and index positions is worth reviewing.
Leverage amplifies both gains and losses on SP500 CFD positions and is a double-edged instrument. Reviewing position sizing ahead of NFP on 2 July 2026 is particularly relevant, as the S&P 500 price can gap sharply on payroll surprises. The VIX settled at 18.41 on 26 June 2026, up from recent lows.

RISK WARNING: CFDs are complex financial instruments and carry a high risk of losing money rapidly due to leverage. You should ensure you fully understand the risks involved and carefully consider whether you can afford to take the high risk of losing your money before trading.
Disclaimer: The information is provided for educational purposes only and doesn’t take into account your personal objectives, financial circumstances, or needs. It does not constitute investment advice. We encourage you to seek independent advice if necessary. The information has not been prepared in accordance with legal requirements designed to promote the independence of investment research. No representation or warranty is given as to the accuracy or completeness of any information contained within. This material may contain historical or past performance figures and should not be relied on. Furthermore estimates, forward-looking statements, and forecasts cannot be guaranteed. The information on this site and the products and services offered are not intended for distribution to any person in any country or jurisdiction where such distribution or use would be contrary to local law or regulation.
References
[1] “Nasdaq Composite posts fifth losing session Friday as chip stocks tumble – CNBC” https://www.cnbc.com/2026/06/25/stock-market-today-live-updates.html Accessed on 29 June 2026.
[2] “Tech Malaise Persists Amid AI Cost, Spending Fears – Charles Schwab” https://www.schwab.com/learn/story/stock-market-update-open Accessed on 29 June 2026.
[3] “Employment Situation Summary May 2026 – U.S. Bureau of Labor Statistics” https://www.bls.gov/news.release/empsit.nr0.htm Accessed on 29 June 2026.
[4] “S&P 500 Index Cash CFD chart – TradingView” https://www.tradingview.com Accessed on 29 June 2026.
[5] “S&P 500 Is Forecast to Climb as Earnings Growth Powers Stocks Higher – Goldman Sachs” https://www.goldmansachs.com/insights/articles/s-and-p-500-forecast-to-climb-as-earnings-growth-powers-stocks-higher Accessed on 29 June 2026.
[6] “Weekly Trader’s Stock Market Outlook – Charles Schwab” https://www.schwab.com/learn/story/weekly-traders-outlook Accessed on 29 June 2026.
[7] “S&P 500 (SP500) – FRED, Federal Reserve Bank of St. Louis” https://fred.stlouisfed.org/series/SP500 Accessed on 29 June 2026.
[8] “US Stocks Are Forecast to Rise 6% in 2026 – Goldman Sachs” https://www.goldmansachs.com/insights/articles/us-stocks-forecast-to-rise-in-2026 Accessed on 29 June 2026.
