Oil Prices Today: Brent at $73, WTI at $71 After 23% Drop
Vantage Editorial Team >
Vantage Editorial Team >
Vantage is a global, multi-asset broker with a team of in-house writers and market analysts who produce educational and insightful trading content for traders of all levels.
As of 02:10 (UTC) on 30 June 2026, the Brent crude oil price (UKOUSD) sat near $73.43 a barrel, up 0.06% on the session, while WTI oil (USOUSD) traded around $70.86, up 0.16%, based on the Vantage UKOUSD CFD and Vantage USOUSD CFD price feeds.
Brent has fallen roughly 22-24% over the past month[1], depending on the benchmark and pricing source, among the sharpest one-month declines of the conflict, even though it is still trading higher than a year ago. That is the headline for crude oil prices today: both benchmarks have spent the past week stabilising after a sharp slide, the same slide that unwound most of the war premium built up after the United States and Israel struck Iran in late February.
This piece reads the oil price chart for Brent and WTI, sets that against the commodities news driving the move, and lays out the levels traders are watching into the next session. See all latest oil price news here.
All prices are as of 30 June 2026 (UTC / GMT+8). Charts are indicative and from TradingView. This is not financial advice.
Key Points
- Brent crude oil price and WTI sat near $73.43 and $70.86 respectively as of 30 June 2026, both holding above the multi-month lows reached in mid-June.
- A fragile US-Iran ceasefire over Strait of Hormuz shipping routes is set for technical talks in Doha on 30 June 2026, after five days of strikes briefly threatened the truce.
- OPEC+ supply additions through the second half of 2026 are adding to downward pressure on oil prices even as Gulf shipping risk stays a live factor.
Brent Oil Price Chart: What It Is Showing
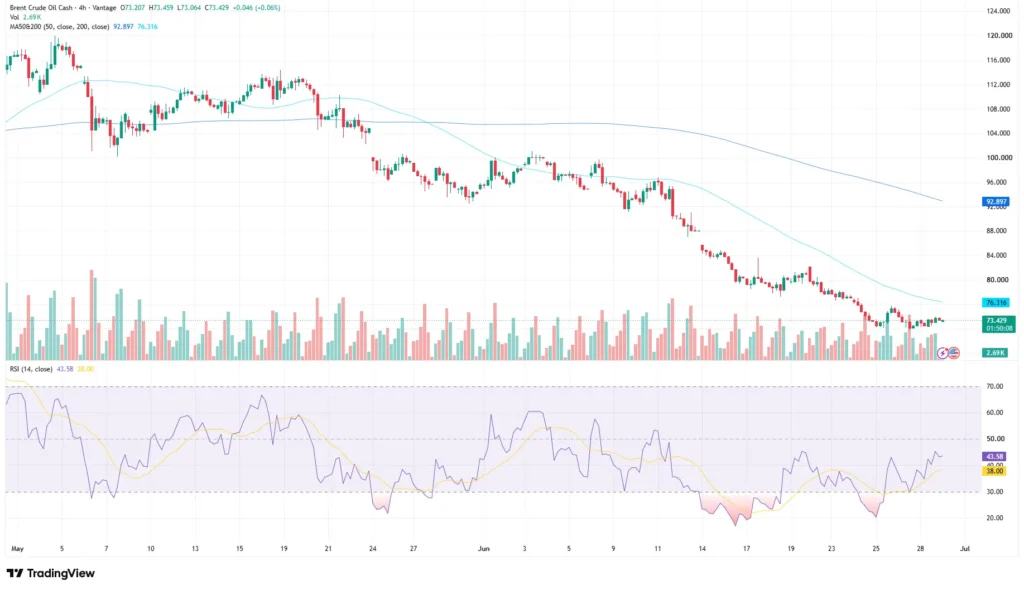
The Brent oil price chart on UKOUSD shows a sustained downtrend from above $116 in early May to the current consolidation in the low $70s. Price sits well below both moving averages: the 200-period MA reads 76.316 while the 50-period MA reads 92.897, attributed to the TradingView setup used for this analysis. The 50-period MA sloping down toward the longer-term 200-period MA reflects the unwind that has played out since mid-May.
The steepest leg ran from mid-June, when Brent dropped from the high $90s toward the high $70s within days. Since 24 June, price has flattened into a narrow band between roughly $72.50 and $74.00, with smaller candles replacing the heavy selling seen earlier in the month.
The RSI on this chart sits at 43.58, signal line 38.00, attributed to the TradingView setup used for this analysis. Both readings sit below the neutral 50 mark but clear of the oversold levels near 20 seen in mid-June, suggesting selling pressure has eased without a clear recovery yet.
WTI Crude Oil Price Chart: What It Is Showing
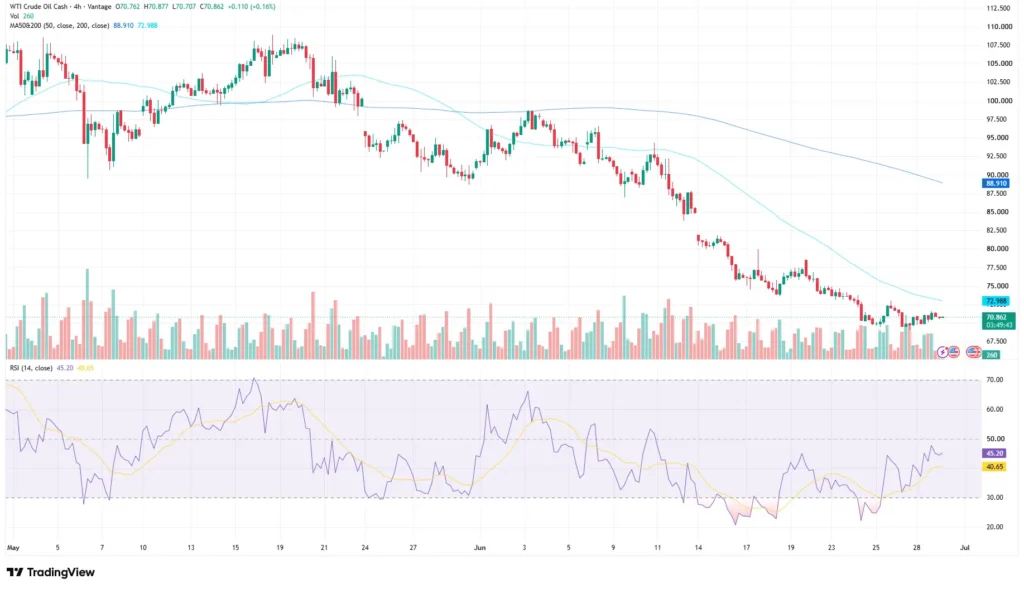
The USOUSD chart tells a closely related story. WTI peaked above $107 in mid-May before rolling into the same decline seen in Brent, falling to lows near $67.50 in mid-June.
The 200-period MA reads 72.988 while the 50-period MA reads 88.910, attributed to the TradingView setup used for this analysis. Price has spent the past several sessions attempting to reclaim the declining 200-period MA from below, while remaining well beneath the longer-term 50-period average, with the latest four-hour candles closing just under the 200-period MA near $70.86.
RSI on the WTI crude oil price chart sits at 45.20, signal line 40.65. That places WTI’s momentum reading marginally higher than Brent’s, in line with WTI’s smaller percentage decline from its May peak.
Volume on this chart, attributed to the Vantage CFD feed, has stayed thin through the consolidation, in line with a market that has largely priced in the ceasefire de-escalation and is now waiting on the next catalyst.
Oil News Today: Hormuz Ceasefire and OPEC+ Supply

A ceasefire that keeps surviving its own collapse
The Strait of Hormuz has driven both benchmarks since the Middle East conflict began on 28 February 2026[2]. A ceasefire framework signed on 17 June 2026 extended the US-Iran truce by 60 days, but fresh strikes broke out on 25 and 26 June after both sides accused each other of violating it[3].
The US and Iran agreed late on 28 June to halt further strikes, with technical talks expected in Doha on 30 June, the same cut-off used for this analysis[3]. Shipping activity has gradually resumed through the Strait of Hormuz since the 17 June 2026 agreement, although vessel flows remain below normal and logistics continue to normalise, with Gulf exports reported near 75% of pre-war levels before this latest flare-up[1].
Brent’s roughly 10% weekly decline into 28 June 2026, its largest weekly drop in a month, coincided with that recovery in shipping volumes rather than any single data release[1]. As transit risk through Hormuz eased, the premium attached to both benchmarks unwound with it, which is the main commodity market news story behind the move.
OPEC+ adding barrels into a cooling market
Supply has not stood still while the geopolitical premium faded. OPEC+ members agreed to a fresh output adjustment earlier in the year, part of a broader plan to restore withheld supply through the second half of 2026[4], a decision that followed the UAE’s exit from the group’s coordinated quota system.
Saudi Arabia has resumed tanker loadings at Ras Tanura, and Gulf producers including the UAE, Kuwait, and Qatar have signalled intent to lift supply further, despite reported tanker shortages[1]. Iraq is separately seeking a higher OPEC quota to recover output lost during the conflict[1].
A market regaining safe shipping access while producers add barrels tends to weigh on price, consistent with the range-bound, lower-than-May levels both benchmarks are trading at now. Read this guide to learn everything you need to know about oil trading.
Levels to Watch
The table below covers reference zones traders are monitoring on both benchmarks. These are observation levels, not trade signals.
| Instrument | Support | Resistance | What’s happening |
| Brent (UKOUSD) | 72.50 / 71.00 | 76.30 / 80.25 | Holding above the 72.50 zone after the post-ceasefire slide |
| WTI (USOUSD) | 69.30 / 67.50 | 72.99 / 76.00 | Consolidating just under the 50-period moving average |
Table 1: Key levels as of 30 June 2026, 02:10 (UTC). Sources: TradingView, Vantage CFD feed. Indicative only.
- Brent (UKOUSD) is holding above the $72.50 zone that capped the mid-June low. A close back below the 200-period MA at 76.316 would put price back inside the band it broke down from.
- WTI (USOUSD) is testing its 200-period MA at 72.988 from below, a pivot through the consolidation phase and the level traders are watching most closely heading into the Doha talks.
What to Watch This Week
- Doha Technical Talks, 30 June 2026: US and Iranian officials meet on the Strait of Hormuz transit dispute. The outcome will likely set the tone for the next session on both benchmarks.
- EIA Weekly Petroleum Status Report: US crude inventory data is a regular input for WTI price action and is published weekly by the US Energy Information Administration.
- OPEC+ Output Compliance: Further commentary from Gulf producers on tanker availability and loading schedules at Ras Tanura and other terminals, a factor in crude oil supply and demand.
- Strait of Hormuz Shipping Data: Vessel transit volumes through the corridor are the most direct, near-real-time gauge of how durable the de-escalation is.
On risk management: both benchmarks have moved sharply on Hormuz-related commodities news over the past month, and that pattern has not gone away. Stop Loss placement around the support and resistance zones above is one way traders are accounting for that. If a position is held in correlated commodities or currencies, checking combined exposure is worth doing, since a renewed shipping disruption could move several positions in the same direction at once.
Leverage works both ways in a market reacting this quickly to oil news today and geopolitical headlines. Position sizing relative to account equity is worth revisiting ahead of the Doha talks, given how much both benchmarks have moved on a single news cycle in the past two weeks.

RISK WARNING: CFDs are complex financial instruments and carry a high risk of losing money rapidly due to leverage. You should ensure you fully understand the risks involved and carefully consider whether you can afford to take the high risk of losing your money before trading.
Disclaimer: The information is provided for educational purposes only and doesn’t take into account your personal objectives, financial circumstances, or needs. It does not constitute investment advice. We encourage you to seek independent advice if necessary. The information has not been prepared in accordance with legal requirements designed to promote the independence of investment research. No representation or warranty is given as to the accuracy or completeness of any information contained within. This material may contain historical or past performance figures and should not be relied on. Furthermore estimates, forward-looking statements, and forecasts cannot be guaranteed. The information on this site and the products and services offered are not intended for distribution to any person in any country or jurisdiction where such distribution or use would be contrary to local law or regulation.
References
[1] “Brent crude oil – Price – Chart – Historical Data – News – Trading Economics” https://tradingeconomics.com/commodity/brent-crude-oil Accessed on 30 June 2026.
[2] “2026 Iran war – Britannica” https://www.britannica.com/event/2026-Iran-war Accessed on 30 June 2026.
[3] “Trump and Iran issue conflicting statements about new talks – Reuters, via CNN” https://www.cnn.com/2026/06/29/world/live-news/iran-war-strikes-trump Accessed on 30 June 2026.
[4] “OPEC+ announces output increase in first meeting without UAE – CNBC” https://www.cnbc.com/2026/05/03/opec-announces-188000-barrels-per-day-output-increase-.html Accessed on 30 June 2026.
