
Every trader has seen it: The market falls hard, then begins climbing at a slow, reassuring pace. It feels like a recovery, a chance for the bulls to breathe again. But sometimes, that gentle climb is not a rescue—it’s a pause before the next decline.
On the charts, this is where the bear flag pattern lives. It signals to traders that the prevailing downward momentum is merely temporary. Knowing how to identify a bearish flag may help traders better understand downtrends and avoid a false reversal.
Keep reading to find out what a bear flag pattern looks like, the two common variations of this candlestick chart pattern, and what mistakes traders should avoid when trading the bear flag pattern.
What Is a Bear Flag Pattern?
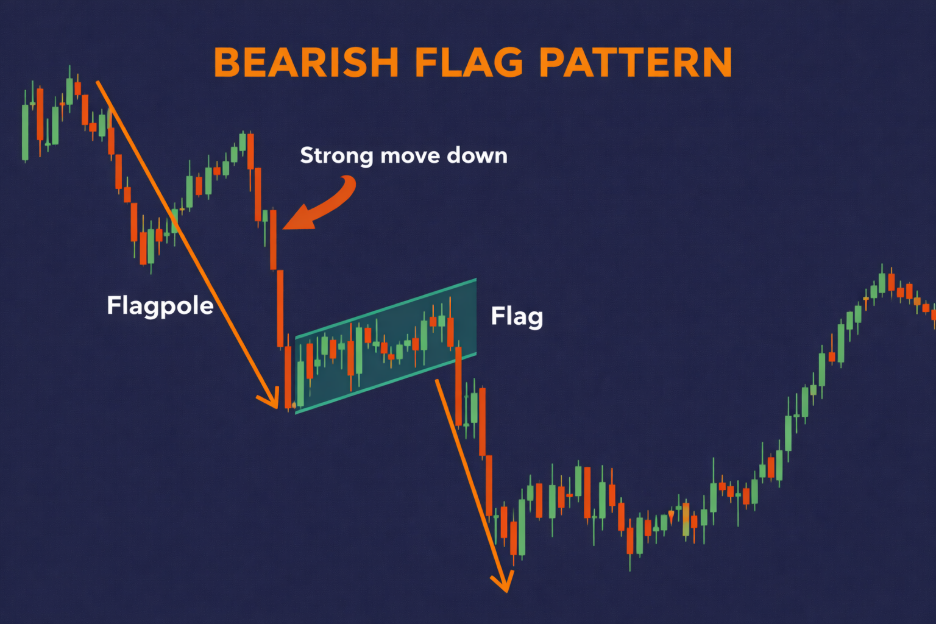
A bear flag pattern is a classic technical formation that signals a temporary pause in a prevailing downtrend. Typically, price drops sharply, forming the flagpole. It then pulls back into a narrow, upward-sloping consolidation channel to create the flag.
Rooted in market psychology, the bear flag pattern represents a period where sellers are gradually finishing profit-taking during the flag and buyers are attempting a weak recovery. However, this recovery lacks conviction, which leads to price breaking below the lower boundary of the consolidation—known as the bear flag pattern breakout—resuming the prior downtrend with renewed force.
Anatomy of a Bear Flag Chart Pattern
To identify a bear flag candlestick pattern, traders normally look out for the following structural characteristics:
1. The Flagpole: Downward Price Movement
The bear flag chart pattern typically begins with a vertical or near-vertical fall, representing strong selling pressure. You can interpret it as sellers are in control, and buyers are stepping aside.
2. The Flag: Consolidation Channel
Next comes a brief correction. Price drifts slightly upwards between two parallel trendlines. Traders need to take note that this is not a recovery but simply the market pausing for breath.
The tone changes from panic to cautious optimism, but underlying selling pressure persists.
3. The Breakout Point
The bear flag pattern breakout is the specific level where the price closes below the lower trendline, which may be interpreted as confirmation of the bearish candlestick pattern.
4. The Target Projection
A “measured move” is calculated by taking the height of the flagpole and projecting it downwards from the breakout point.
What Is the Difference Between the Bull Flag Pattern vs. Bear Flag?
Understanding the bull flag pattern versus bear flag is essential for maintaining directional bias. While both are continuation patterns, they are mirror opposites in terms of market structure and sentiment.
The following table summarises the key differences between the bull flag and bear flag patterns:
| Feature | Bull Flag | Bear Flag |
| Trend Direction | Uptrend | Downtrend |
| Flag Slope | Slightly downward | Slightly upward |
| Market Sentiment | Temporary pause in buying | Temporary relief in selling |
| Expected Move | Continuation higher | Continuation lower |
If you want to understand more about the bull flag pattern, you can read our in-depth guide on how to identify and analyse it.
2 Common Variations of the Bear Flag
While the core mechanics remain the same, the bear flag pattern formation can manifest in different shapes depending on how the market consolidates. Recognising these variations is crucial for setting accurate entry triggers and stop-loss levels.
1. Rectangular Bear Flag
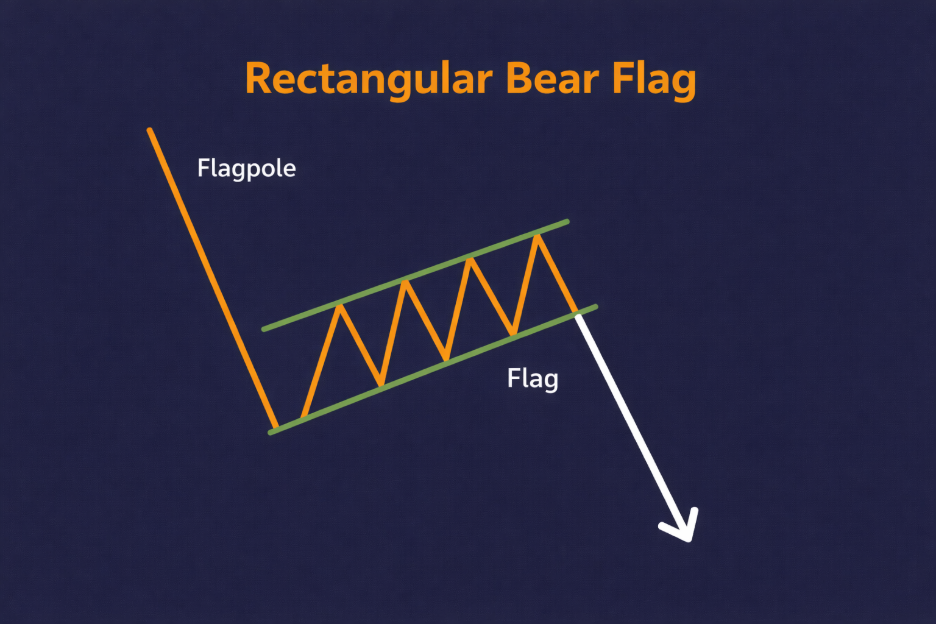
The rectangular bear flag is the ‘textbook’ version most traders recognise. In this formation, the consolidation phase usually consists of a clean, upward-sloping or horizontal channel. Price bounces between two parallel trendlines, indicating a steady but weak attempt by buyers to push back against the initial crash.
2. Triangular Bear Flag (Bear Pennant)
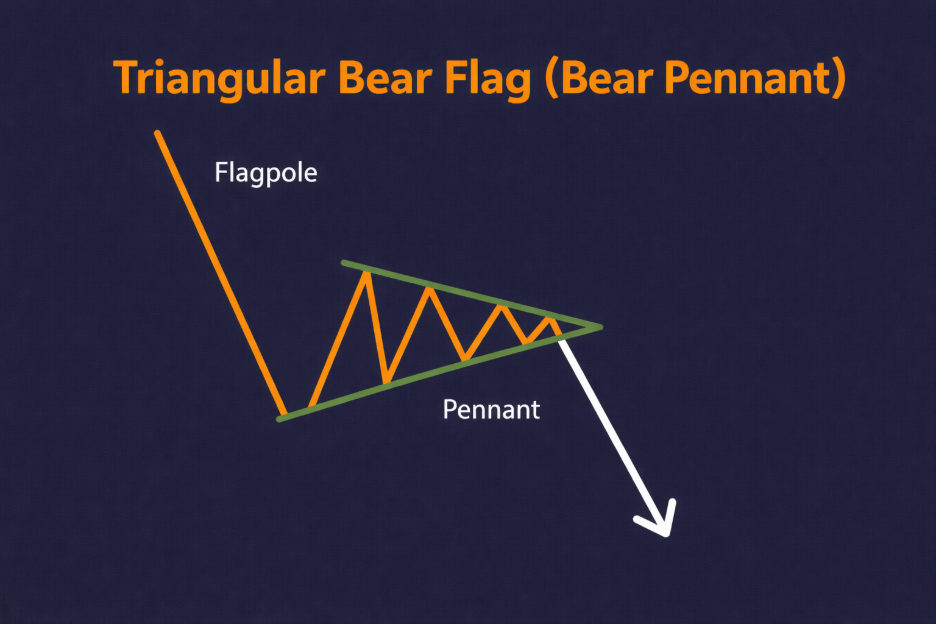
Often referred to as a bear flag wedge pattern or a bear pennant, the triangular bear flag variation features a consolidation phase that narrows over time. Instead of parallel lines, the highs and lows converge to form a small symmetrical triangle.
While the shape differs, the underlying psychology remains the same: A brief period of shrinking volatility before the next leg down. The triangular bear flag may lead to a stronger breakout because of the “coiled spring” effect of the narrowing price action.
Across both variations, the story doesn’t change. Fear leads to a price drop while calmness leads to a pause, and then renewed fear leads to a further decline.
Related Article: The Basics of Trading Psychology
Insights on the Bear Flag
Understanding the bear flag pattern goes beyond knowing how to spot it on the charts.
The reliability of this bear flag continuation pattern is dependent on the interaction between the price slope, trading volume behaviour, and the underlying momentum to offer clues to traders about whether the bearish trend is likely to continue or break up. These technical nuances can help one differentiate between stronger and weaker setups, especially in fast-moving markets.
What’s the Importance of the Slope in the Bear Flag Pattern?
The angle of the consolidation phase in a bear flag pattern is a primary indicator of the trend’s health. In a classic bear flag pattern formation, traders might observe either one of the following signs:
- Gentle Upward Slope: This reflects a healthy continuation pattern. It shows that while buyers are trying to push up the price, their strength is quickly exhausted by overhead supply.
- Steep Upward Slope: A steep or aggressive retracement signals weakening momentum and stronger buying interest. If the ‘flag’ retraces more than 50% of the flagpole, the pattern becomes less reliable as it may signal a genuine trend reversal rather than a pause.
Think of the slope as the “angle of resistance”. If the climb is too steep, the downtrend may be losing energy, increasing the risk of a failed breakout.
Related Article: Trend Analysis Complete Guide: How to Use It
Is Volume Analysis a Key Indicator in Identifying the Bear Flag Pattern?
Trading volume acts as the ‘heartbeat’ of the bear flag pattern, providing additional confirmation for price action. To validate the move, traders typically look for specific volume cues across three stages:
- The Flagpole (High Volume): The initial sharp sell-off should occur during heavy trading volume, confirming aggressive selling pressure and institutional participation.
- The Consolidation (Low Volume): As price enters the upward-sloping channel, volume should visibly fade. Declining volume indicates that ‘recovery’ lacks conviction and buyers are not committed to a reversal.
- The Breakout (Surging Volume): When price finally breaks through the lower trendline, a spike in volume is often used as confirmation of a bear flag pattern. This surge signals that sellers have returned in force to drive the next leg of the downtrend.
Heavy volume in the flagpole, light volume in the pullback, and resurging volume in the breakout forms the ideal volume profile of a valid bear flag. Without this confirmation, a bear flag pattern in uptrend corrections or ranging markets is much more likely to fail.
Is Using the Bear Flag Pattern Reliable?
The bear flag pattern is commonly regarded as a widely used continuation pattern in technical analysis. However, as with all candlestick chart patterns, its reliability is not absolute.
Think of the bear flag chart pattern as a probability indicator instead of a guarantee. Whether you’re analysing a forex bear flag pattern or a bear flag pattern for a specific stock, it’s always best to use it in conjunction with other analysis tools.
What Are the Pros and Cons of the Bear Flag Pattern?
Understanding both the pros and cons of the bear flag pattern is essential for any trader looking to leverage relevant market opportunities. While the pattern can provide a high-probability setup under the right conditions, it can also be undermined by ‘whipsaws’ if the broader context is ignored.
| Pros | Cons |
| Clear trend continuation structure Bear flags help traders spot trend continuation by showing when a short pause in a downtrend is likely to break lower again. | Not a guarantee in volatile markets In fast or unpredictable markets, sharp price spikes can cause the bear flag pattern to break the wrong way and confuse some traders, especially beginners. |
| Offers measurable entry and target levels Bear flags offer clear entry and exit levels, helping new and seasoned traders calculate with more precision on where to enter, place a stop-loss, and plan a target. | False breakouts if confirmation is ignored A bear flag pattern breakout can be a trap if traders enter too early, especially if they do not wait for a strong, confirmed move. |
| A foundation for risk management When it comes to small, controlled bearish flag stop-losses, the tight consolidation zone gives traders room for consideration. | Sensitivity to market news or events Traders should take note that even a well-formed bear flag pattern can fail due to sudden economic reports or market-moving events. |
| Volume-based confirmation Volume usually drops during the flag and rises during the breakdown, providing traders with more conviction. | Requires emotional discipline Bear flag patterns can look different across timeframes. As such, misreading them without multi-timeframe analysis is common. |
Related Article: News Trading Strategies: How to Trade the News
5 Mistakes Traders Should Avoid When Trading the Bear Flag Pattern
Even a statistically reliable setup like the bear flag pattern can lead to avoidable losses if executed poorly or rashly. Traders are thus advised to steer clear of these common pitfalls:
- Entering Before Breakout Confirms: Entering a position while the price is still within the consolidation channel. Always wait for a confirmed close below the lower support line.
- Ignoring the Flag’s Slope: Mistaking a steep, aggressive recovery for a flag. If the retracement is too strong (exceeding 50% of the flagpole), the bearish momentum has likely disappeared.
- Misjudging Volume: Assuming a move is a continuation without the relevant volume indicators.
- Setting Overly Tight Stop Losses: Placing a bearish flag stop loss too close to the entry point, which results in being stopped out by normal market noise before the move actually begins.
- Ignoring the Macro Context: Trading a bear flag that is directly forming inside a strong bullish reversal zone may fail.
Now that you’re aware of the common mistakes, let’s learn how to actually trade a bear flag chart pattern.
How to Trade a Bear Flag Chart Pattern: A Step-by-Step Guide
Executing a bear flag trading pattern effectively requires recognising the full pattern, confirming momentum, and applying disciplined risk management.
While the formation looks straightforward on a bear flag chart pattern, each step in the execution process serves to filter weak signals and avoid the common pitfall of a false bearish flag signal.
Keep reading for a step-by-step guide on how to trade a bear flag pattern.
1. Determine When to Enter the Bear Flag Pattern
Patience is the most critical element of this bear flag pattern guide.
Before committing capital, do ensure the pattern is structurally complete as per what we’ve shared previously. Look for a high-velocity flagpole followed by a tight, ascending consolidation channel.
Some traders may look to enter during a bear flag pattern breakout. Specifically, some traders look for a candle to close below the lower trendline of the flag. Entering on the ‘close’ of the breakout candle (with indication of strong trading volume)—rather than as the price is moving—reduces the risk of being caught in the ‘wick’ reversal.
2. Setting the Profit Target
A standard bear flag pattern target is determined by the “measured move” method. Traders usually calculate the height of the initial flagpole (from the start of the drop to the bottom of the flag) and project that same distance downwards from the breakout point.
For advanced bear flag pattern trading, some traders prefer a tiered exit strategy:
- Target 1: 50% of the flagpole height (to secure initial profits)
- Target 2: 100% of the flagpole height (the full measured move)
With a tiered strategy, it may provide a logical and consistent way to estimate how far the next wave of selling might run.
3. Exit Strategy: The Bearish Flag Stop Loss
A stop loss is often placed just above the upper boundary of the flag, since a move back into the flag or above its peak invalidates the bear flag continuation pattern, suggesting that bearish momentum has failed.
As price moves in your favour, some traders may consider using a trailing stop to lock in gains or gradually scale out to secure profits whilst allowing the trend to continue.
4. Enhancing Reliability With Other Technical Indicators
While the chart pattern is the primary signal, bearish flag technical analysis is strengthened when combined with other technical indicators such as:
- Moving Averages (MAs): If the pattern forms below a declining 50-period or 200-period simple moving average (SMA), the broader trend confirms the bearish bias.
- Relative Strength Index (RSI): An RSI value dropping below 50 during the breakout suggests increasing downward momentum.
- Moving Average Convergence Divergence (MACD): A bearish crossover or widening histograms during the breakout provides secondary confirmation that the trend is resuming.
Bear in mind that these tools do not replace the bear flag pattern, but they could help add confidence by showing that multiple signals are pointing in the same direction.
5. Practise trading the Bear Flag Pattern With Vantage
Refining your ability to spot a bear flag pattern requires hands-on experience. As the saying goes, practice makes perfect. That’s when traders can consider opening a Vantage Demo Account to practise identifying patterns, testing entry timing, and experimenting with stop placements.
Once you are confident, you may explore applying these techniques in live market conditions using a Vantage Live Account, where appropriate.
Trading the Bear Flag in Bearish Markets
In summary, the bear flag pattern is a structured continuation signal that traders can consider when navigating a market that is trending lower. Master its key characteristics of a sharp decline, a brief period of calm, and a renewed downwards push.
However, no candlestick pattern should be used on its own. Broader market conditions, volume analysis, and disciplined risk control all remain essential parts of the process. It’s essential that traders understand how the bear flag chart pattern forms, able to recognise its variations, and wait for solid confirmation before entering live markets.
Frequently Asked Questions (FAQs)
Can a bear flag be bearish?
Yes, the bear flag is a bearish continuation pattern that signals the prevailing downward momentum is likely to resume after a brief period of consolidation.
What does “bear flag” mean?
A bear flag refers to a specific market structure consisting of a sharp, high-volume price drop (the flagpole) followed by a shallow, low-volume upward retracement that resembles a flag on a pole. This chart formation indicates sellers are temporarily pausing before driving the price to new lows.
How reliable is a bear flag?
The bear flag is reasonably reliable in trending markets, particularly when supported by volume and other confirmation indicators. However, like all candlestick patterns, the bear flag is not entirely foolproof.
What is the recommended timeframe for trading the bear flag pattern?
Bear flags can appear on all timeframes. Day traders typically prefer trading the bear flag pattern on 15-minute and 1-hour charts for intraday setups, while swing traders normally choose 4-hour or daily charts to filter out market noise and identify high-conviction institutional moves.
Is it still a bear flag if the price goes back up after forming the flag?
If the price breaks above the upper boundary of the flag, the pattern is no longer valid. A bear flag only stays intact as long as price moves within the channel and eventually breaks downwards.
Can the price move sideways instead of up during the flag?
Yes, a bear flag can slope slightly upwards or move sideways. What matters is that the consolidation is smaller and slower than the initial drop.
Is it better to trade bear flags on shorter or longer timeframes?
Shorter timeframes offer more frequent setups but can be noisy. Longer timeframes are smoother, and often more reliable, especially for beginners.
RISK WARNING: CFDs are complex financial instruments and carry a high risk of losing money rapidly due to leverage. You should ensure you fully understand the risks involved and carefully consider whether you can afford to take the high risk of losing your money before trading.
Disclaimer: The information is provided for educational purposes only and doesn’t take into account your personal objectives, financial circumstances, or needs. It does not constitute investment advice. We encourage you to seek independent advice if necessary. The information has not been prepared in accordance with legal requirements designed to promote the independence of investment research. No representation or warranty is given as to the accuracy or completeness of any information contained within. This material may contain historical or past performance figures and should not be relied on. Furthermore estimates, forward-looking statements, and forecasts cannot be guaranteed. The information on this site and the products and services offered are not intended for distribution to any person in any country or jurisdiction where such distribution or use would be contrary to local law or regulation.