IIndices are the heartbeat of the financial world, acting as pivotal indicators that track the collective performance of hand-picked stocks to reveal the true health of the market. These financial benchmarks, including the well-known S&P 500 in the United States, help investors and traders assess the relative performance of individual portfolios and understand broader economic movements.
As we move through 2026, staying ahead of the curve requires a deep understanding of which markets are driving growth and which are facing headwinds. This article offers an essential overview of the major indices you should be watching this year.
Key Points
- Indices track collective stock performance, serving as benchmarks and economic indicators, like the S&P 500 in the U.S.
- Indices, composed based on criteria like market cap, can be traded indirectly through mutual funds, ETFs, or CFDs, highlighting the importance of their calculation methods.
- Trading indices offers broad market exposure, diversification, and reduced volatility, making it efficient for strategic investment in sectors represented by the S&P 500, Nasdaq, and DJIA.
What are Indices?
Understanding the Basics
Think of an index as a high-speed snapshot. By tracking a collection of assets—like stocks, bonds, or commodities—indices allow you to gauge market health at a single glance.
Major indices like the S&P 500 act as the ultimate benchmark. Because this specific index tracks 500 of the largest companies in the United States, it is widely used to judge the overall strength of the American economy.
How They Are Built
The “recipe” for an index depends on its purpose. Components are selected based on specific rules, such as:
- Market Capitalisation: Larger companies carry more weight (e.g., S&P 500).
- Industry Sector: Focused on specific areas like technology or healthcare.
- Geography: Tracking markets in specific countries or regions.
To ensure the index remains accurate, these components are weighted and updated in real time during trading hours. This means that as stock prices flicker on the exchange, the index value moves instantly to reflect those fluctuations.
Can You Trade Them?
Here is the catch: you cannot actually “buy” an index itself because it is just a mathematical calculation.
While you can’t own the calculation, you can trade financial products designed to mimic it. Most traders in 2026 use these three primary vehicles to gain exposure to major indices:
- Exchange-Traded Funds (ETFs): These allow you to buy shares in a fund that holds all the stocks in the index.
- Mutual Funds: Professional managers pool your money to track the index’s performance.
- Contracts for Difference (CFDs): These allow you to speculate on price movements without owning any underlying shares.
How are Indices Determined?
Understanding how major indices are calculated is vital for any trader. Why? Because the methodology determines which stocks drive the price action you see on your terminal. Not all indices are created equal, and the way they are “weighted” can drastically change your index trading strategy.
Let’s break down the three most common methods used in 2026.
Price-Weighted Indices
In this model, the index value is determined solely by the share price of its member companies.
- How it works: A stock trading at $200 has double the influence of a stock trading at $100, regardless of which company is actually larger in terms of total value.
- The giants: The Dow Jones Industrial Average (DJIA) and Japan’s Nikkei 225 are the most famous examples of this approach.
Market Cap-Weighted Indices
This is the most common methodology for modern major indices. Here, a company’s influence is proportional to its total market value (Share Price × Number of Shares).
- How it works: The bigger the company, the bigger the impact. This is why a 1% move in Apple or Microsoft affects the index far more than a 1% move in a smaller utility company.
The giants: The S&P 500 and the NASDAQ Composite are the heavyweights here. Because the NASDAQ is market-cap weighted, it is heavily dominated by “Big Tech” giants.
Equal Weight Indices
Looking for a more balanced perspective? Equal-weight indices ignore price and size entirely, giving every single company the same percentage of the pie.
- How it works: In an index of 500 companies, each one accounts for exactly 0.2% of the total movement. This ensures that the “Trillion Dollar Club” doesn’t overshadow the rest of the market.
- The benefit: This method is often used to reduce volatility and provides a better look at the “average” company’s health, and mitigates the effects of substantial price shifts in any single stock. . The S&P 500 Equal Weight Index (EWI) is the primary benchmark for this style.
Why Trade Indices?
Trading indices offer a powerful combination of diversification, stability, and market access that individual stock picking often lacks. By trading major indices through Vantage CFDs (Contracts for Difference), you gain a powerful edge that traditional stock buying simply cannot match.
But why is this the preferred strategy for so many?
Diversification
Stop chasing individual stocks and start trading entire economies. Vantage CFDs allow you to gain exposure to the world’s most powerful sectors through a single position.
- Broad Market Power: Capture the growth of the top 500 US companies via the S&P 500 or dominate the tech sector through the NASDAQ.
- Efficiency: Instead of managing dozens of individual shares, you can execute one trade to diversify your portfolio instantly, saving you time and reducing complexity.
Less Volatility
Trading major indices typically offers a smoother ride than individual stocks. Because an index represents the collective value of numerous companies, the dramatic price drop of one poor-performing stock is effectively diluted by the stability of the others.
- Mitigate Single-Stock Risk: If one company in your 500-stock index has a bad earnings report, the impact on your total position is minimal.
- Better Strategic Planning: Lower volatility aids in clearer long-term decision-making, allowing you to focus on macroeconomic trends rather than the daily chaos of individual corporate news.
Liquidity and Access to Global Markets
The world’s major indices, such as the S&P 500 and the DJIA, are among the most liquid financial instruments on the planet. This means you can enter and exit trades instantly, even with large positions, with minimal price disruption.
- Tighter Spreads: High liquidity translates to lower transaction costs, making index trading a highly cost-effective choice.
- Tap into Global Economies: Modern platforms such as Vantage allow you to trade major indices in the US, Europe, and Asia from a single account. No need for multiple international brokerages; just pure, seamless market access.
Ready to broaden your horizons?
Through Vantage, you can trade major indices via CFDs, combining the simplicity of broad market exposure with the precision of sector-specific targeting. Whether you are looking for a lower-risk entry into the market or a way to hedge your existing portfolio, trading indices with Vantage provides the flexibility you need to trade with confidence.
Top Indices to Watch for Trading
As we move through 2026, these major indices remain the primary targets for traders looking to capitalise on global economic shifts.
Here are the heavyweights you should be tracking:
1. S&P 500 (US)
The S&P 500, or Standard & Poor’s 500, is a stock market index comprising 500 of the largest companies listed on stock exchanges in the US. It’s widely considered the main indicator of the US stock market’s performance and a key gauge for the US economy. This index reflects the performance of a broad segment of the US economy through the aggregate movements of top corporate giants across various industries.
Renowned for its diversity across industries, the S&P 500 is often used as a benchmark for the US markets and is followed by traders worldwide to understand American market trends. The S&P 500 has shown steady, impressive growth over time. Since it expanded to 500 stocks in 1957, its average yearly return through the end of December 2023, is 10.26% [1].
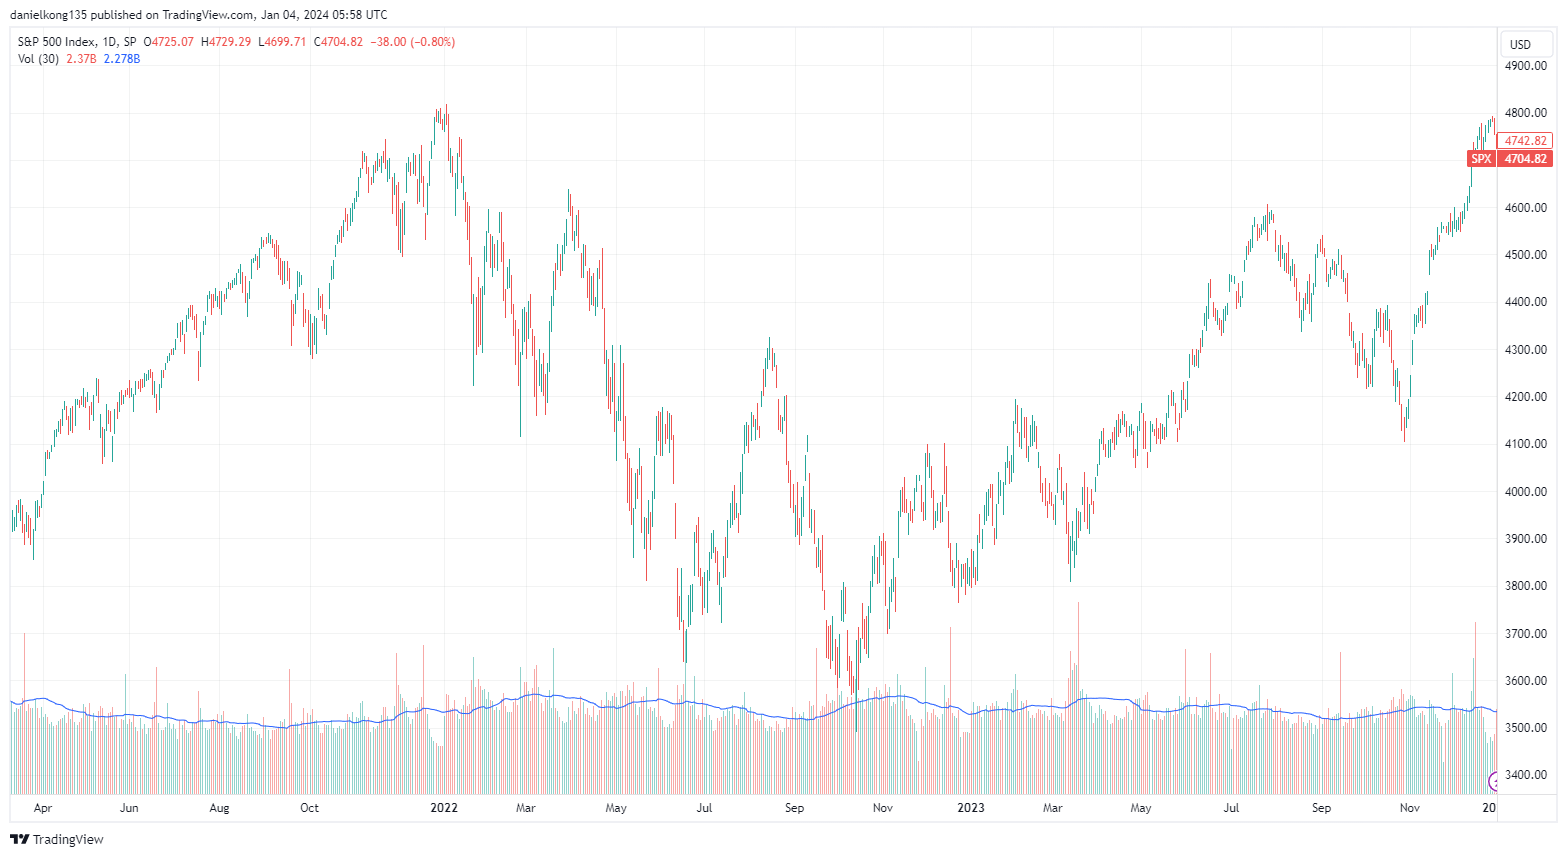
In 2023, the S&P 500 Index displayed a pattern of volatility with growth and overcoming declines in the middle of the year to close at a higher level. Periods of sharp rises and falls throughout the year indicated a reactive market to varying global economic events (Israel-Hamas conflict and the US Federal Reserve Interest Rate Hikes). Despite these fluctuations, the overall trend appears to be positive, with the index ending the year at a higher point than where it started.
Read all about the five key events that happened in 2023, and how they shifted the markets.
2. Nasdaq 100 & Nasdaq Composite (US)
The Nasdaq 100 is a market capitalisation-weighted index comprising 100 of the largest non-financial companies listed on the Nasdaq stock market. Renowned for its heavy concentration in technology and innovation-driven companies, it includes industry leaders from various sectors such as technology, retail, and biotechnology, making it a popular benchmark for high-growth industries.
Meanwhile, the Nasdaq Composite is broader, including over 3,000 companies listed on the Nasdaq stock exchange. It covers a wide range of sectors and is often used to gauge the performance of the overall tech sector as well as the U.S. stock market in general. Both indices are widely followed and are critical tools for investors looking to understand market trends, especially in the technology and innovative sectors.
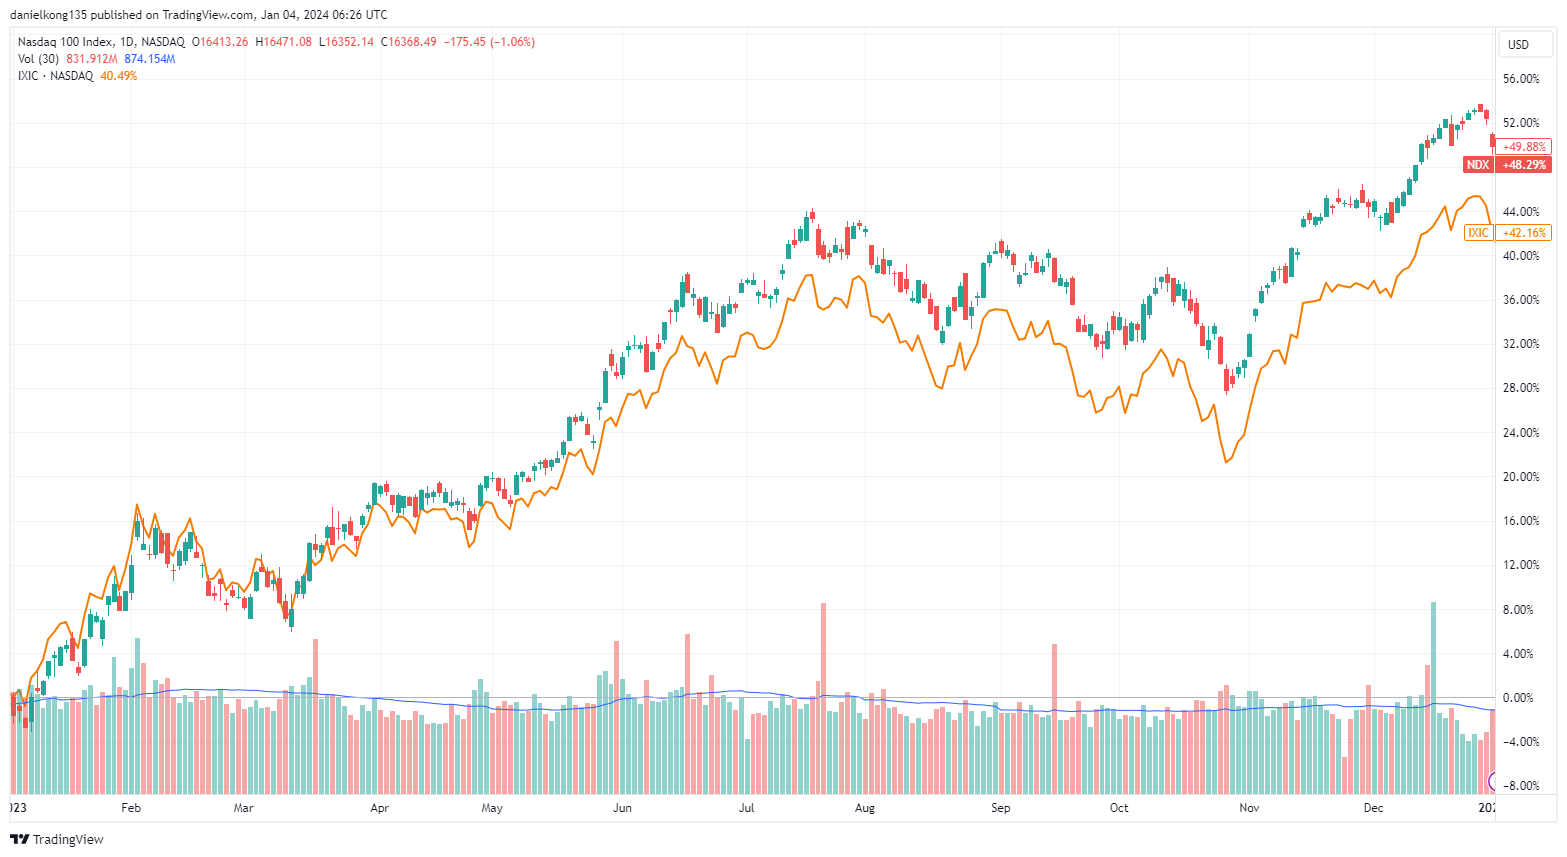
Starting from January 2023, the chart illustrates a consistent upward trajectory for both the Nasdaq 100 and the Nasdaq Composite indices, signalling a cumulative appreciation in their price across 2023. As the year progressed, particularly from November, this positive momentum intensified, suggesting a strong bullish sentiment among investors.
3. Dow Jones Industrial Average (US)
The Dow Jones Industrial Average (DJIA), often referred to as “the Dow,” mirrors the might of the American economy through the lens of 30 titan companies. It tracks 30 large, publicly-owned companies trading on the New York Stock Exchange (NYSE) and the NASDAQ. Founded in 1896, the Dow Jones Industrial Average acts as a key indicator for the US stock market and economy’s health. Traders and financial analysts favour the Dow for its simplicity and the well-known nature of its constituent companies, using it to monitor market trends and adjust trading strategies.
These 30 companies are industry leaders across a variety of sectors, reflecting broader economic performance through their stock prices. Here are some of the companies tracked:
- 3M, a multinational conglomerate operating in fields like worker safety and healthcare;
- Apple, a giant in technology and consumer electronics;
- Coca-Cola, a leader in the beverage industry;
- Disney, a major name in entertainment and media; and
- Procter & Gamble, known for a wide range of consumer goods, just to name a few.
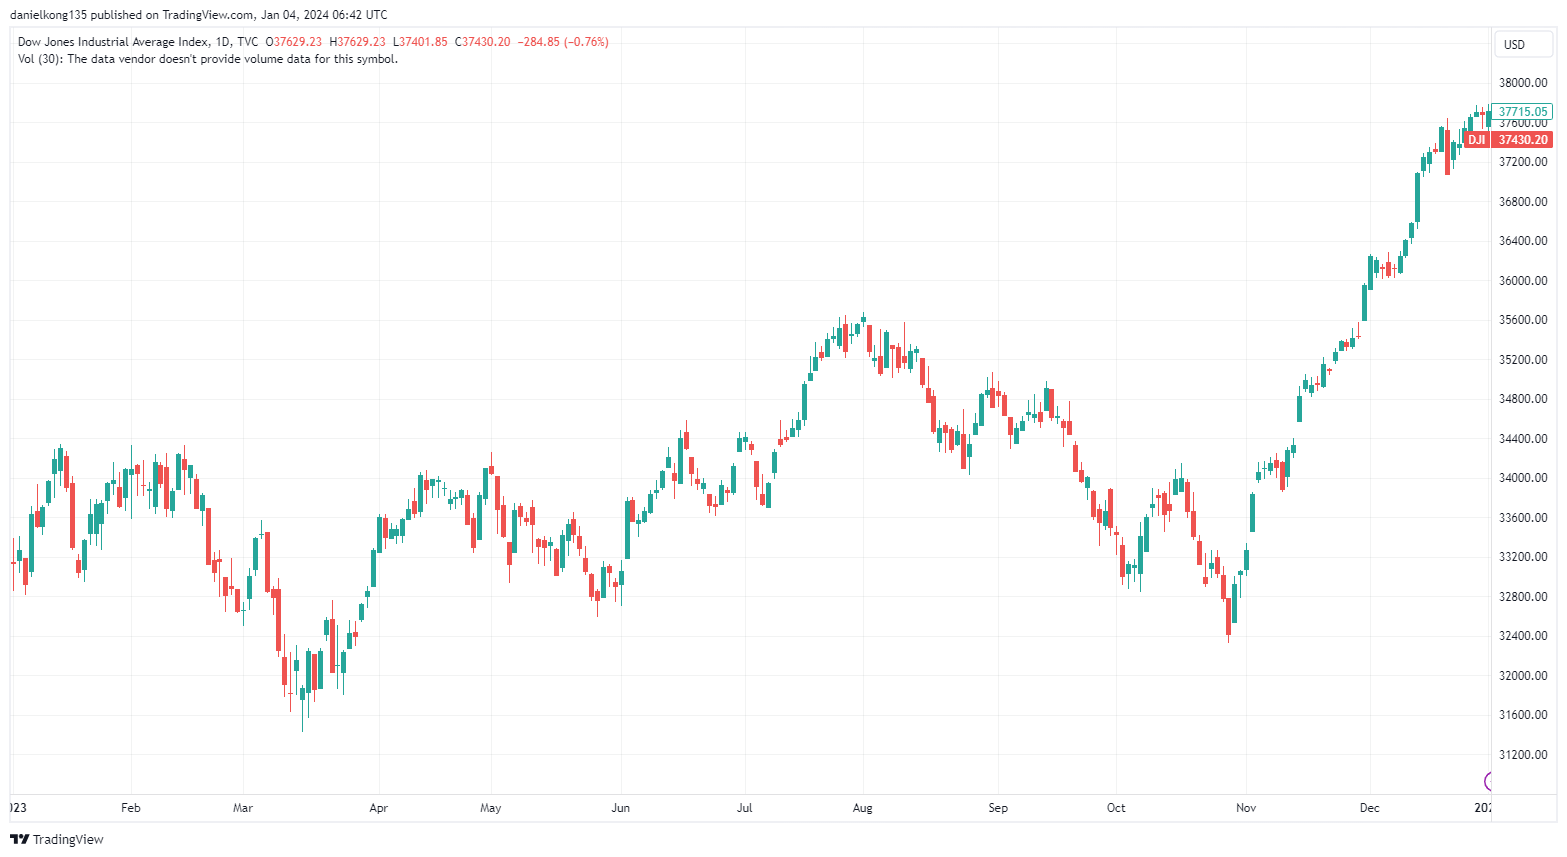
Throughout the year, the index underwent fluctuations, evidenced by the alternating red (downward) and green (upward) candles, signalling a volatile market. In March and October 2023, the market dipped following Federal Reserve Chair Jerome Powell’s implication of higher interest rates due to strong economic data. October’s decline also factored in corporate earnings and an ongoing Federal Open Market Committee meeting that had investors on alert for further financial direction.
4. DAX (Germany)
The DAX, short for Deutscher Aktien Index and also known as GER40, is essentially a stock market index that tracks 40 of the largest and most traded companies in Germany, all listed on the Frankfurt Exchange. Think of it as the heartbeat of Germany’s stock market, reflecting the performance and economic health of the nation’s most influential companies.
These companies vary across sectors, including automotive, technology, pharmaceuticals, and more, painting a diverse picture of Germany’s robust economy. The DAX is a key indicator for investors around the world, marking the trends and shifts in Europe’s strongest economy. From its inception in 1988, the DAX has shown remarkable growth starting from 1,000 and growing to closing at 16,751.64 points in December 2023, showcasing its impressive long-term growth [2].
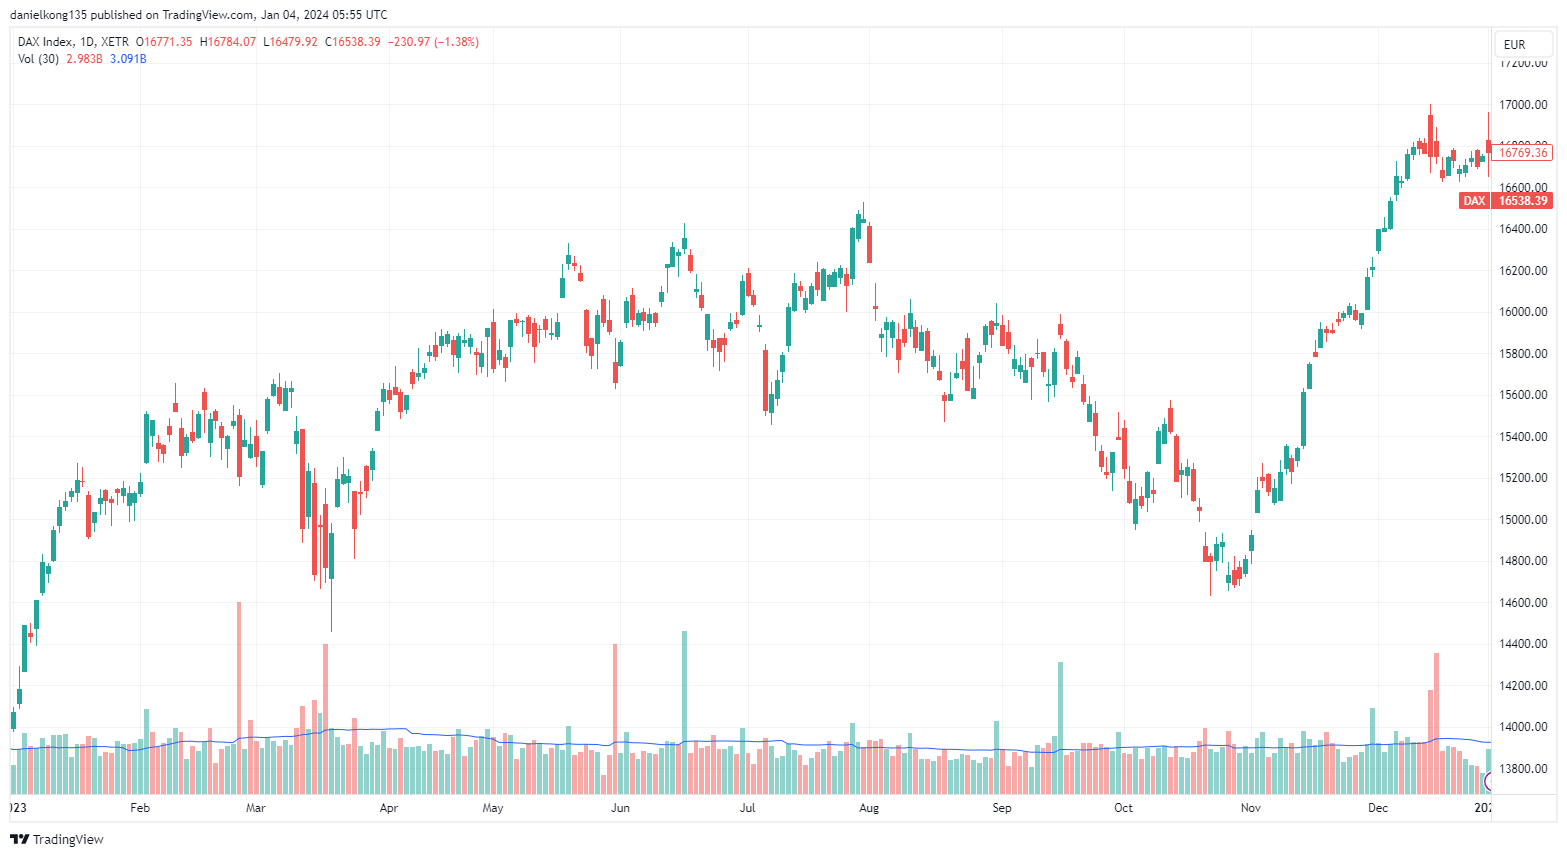
In 2023, the DAX commenced with bullish momentum, only to be met with a correction in March, mirroring market uncertainties and shifting investor sentiment. From April to October, the index entered a consolidation phase, characterised by sideways trading, reflecting equilibrium between buyers and sellers. However, since November, a bullish trend resumed, as evidenced by a string of green candles signalling sustained buying pressure. This rally allowed the DAX to close the fiscal year on a strong note, highlighting its capacity for recovery in a volatile market environment.
5. FTSE 100 (UK)
The FTSE 100, commonly referred to as the “Footsie,” is an index that tracks the top 100 companies on the London Stock Exchange, known for their high market value. It serves as a snapshot of the UK economy, showcasing how sectors like finance, energy, and healthcare are performing.
This index is not only a key indicator for the health of the UK’s economy but also offers a glimpse into the broader European market conditions. Market participants around the world keep a close eye on the Footsie before making or adjusting their trading decisions. The FTSE include major companies like AstraZeneca, Shell, HSBC, Unilever and BP.
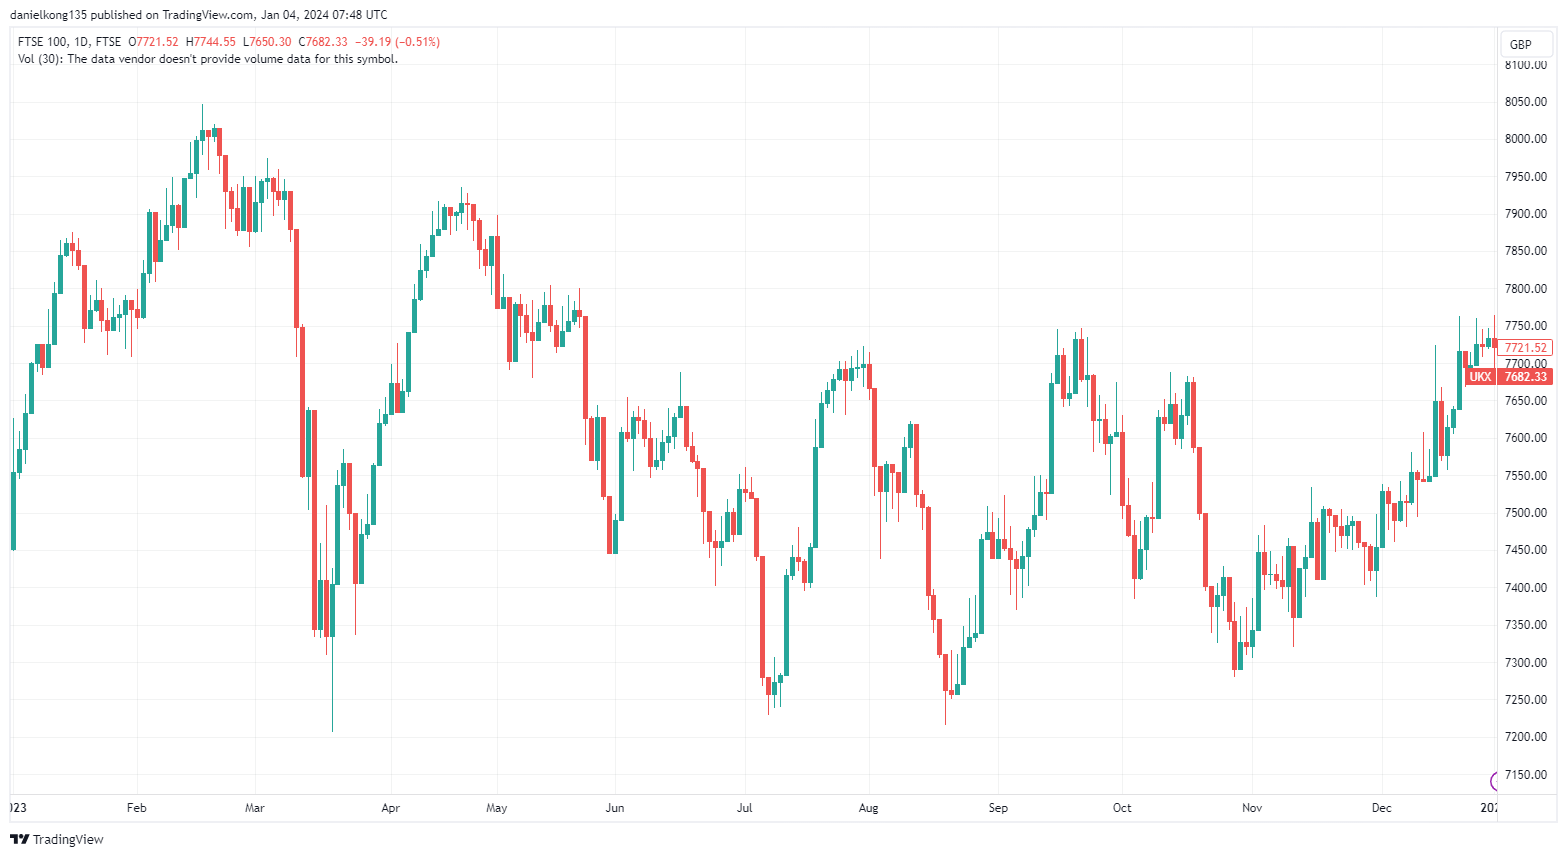
The FTSE 100’s 2023 graph shows a volatile market, oscillating with ups and downs. The index began on a high note but encountered a downturn in March due to economic uncertainties affecting investor sentiment. A period of stability ensued from April to October, with the index moving sideways. A rebound occurred from November, marked by upward bullish trends, although the FTSE 100 did not break its February all-time high.
6. Hang Seng Index (Hong Kong) [3,4]
The Hang Seng Index (HSI) serves as the benchmark for blue-chip stocks, tracking the performance of the largest companies listed on the Hong Kong Stock Exchange (HKEx). The HSI is a free-float, market capitalisation-weighted index, capturing approximately 65% of the total market capitalisation of the HKEx, which stood at over $31 trillion as of December 2023—a slight decline from November’s $31.1 trillion.
Established in 1969 with a base date of 31 July 1964, starting at an index value of 100, the HSI is designed to reflect the economic forefront of Hong Kong.
Comprising 82 major companies, including giants like HSBC Holdings, Alibaba Group, Tencent, and Meituan, the index is structured to prevent dominance by any single entity through an 8% capping rule. This setup ensures a balanced representation of Hong Kong’s corporate leadership on the global financial stage.
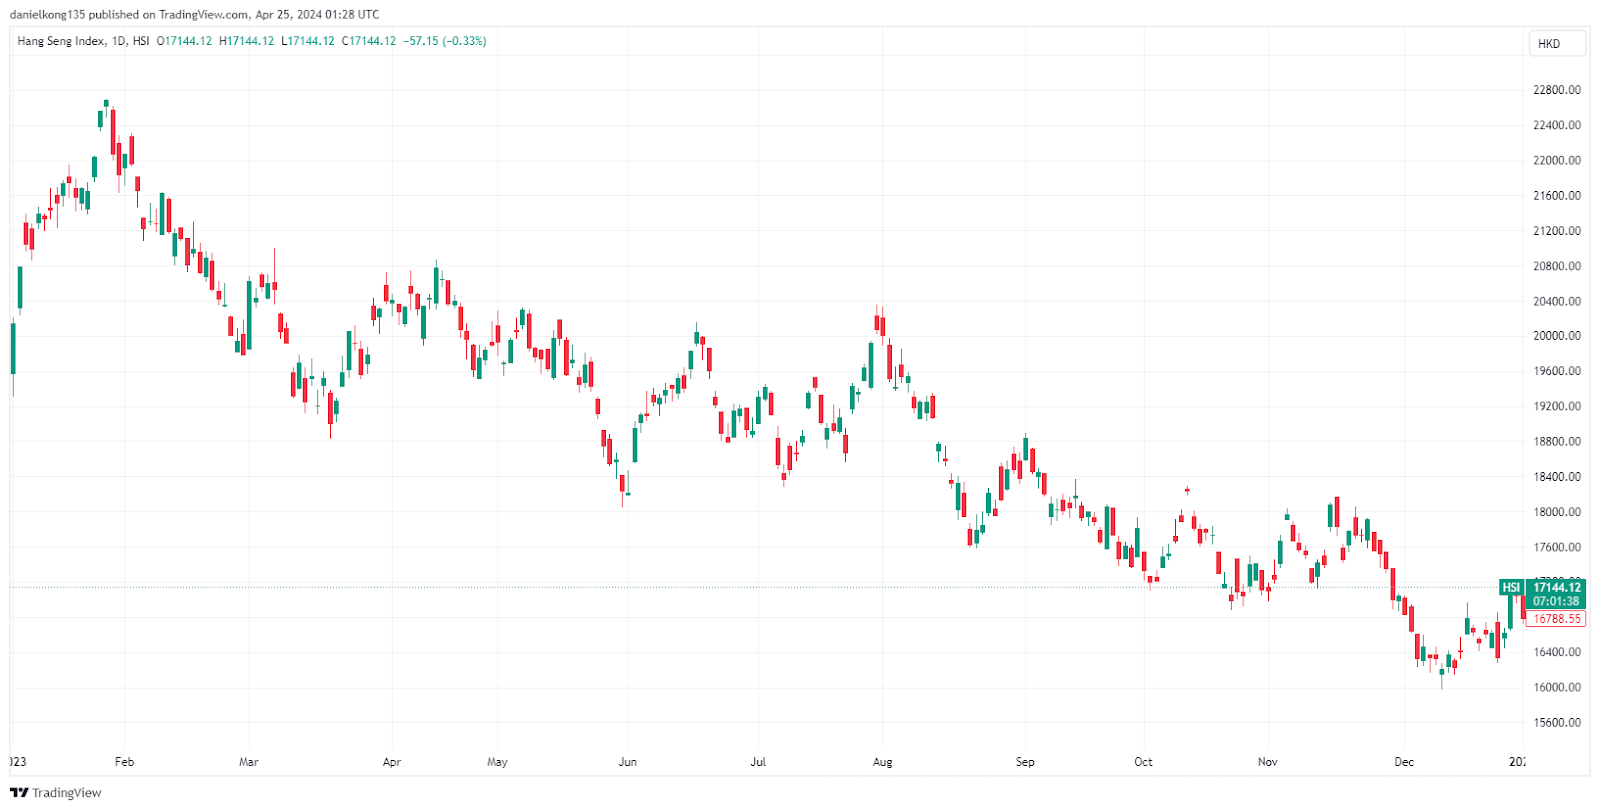
The Hang Seng Index in 2023 exhibited a bearish trend which is characterised by a series of peaks and troughs that marked its volatility throughout the year. The index started the year on an optimistic note, rallying to early closing highs of 22,688, but faced a series of declines reflecting investor caution amidst economic headwinds.
Market confidence took a hit primarily because of troubles in US regional banks and worries over potential changes in Federal Reserve interest rates. This nervousness grew when concerns about China’s economic health came into the picture, pushing the Hang Seng Index further down and adding to the overall downward trend for the year. Around the middle of the year, the Hang Seng Index moved back and forth without a clear trend, showing that the market was uncertain and investors had mixed feelings.
As the year progressed, there were spurts of recovery, with the index recovering back some of its losses, but these were short-lived as it succumbed to selling pressure, finishing the year without recapturing its early momentum.
In 2024, the Hang Seng Index continued to reflect the market’s uncertainty, showing a bearish trend that carried over from 2023. Although occasional bullish rallies offered hope for a turnaround, these upswings were generally followed by downturns that tested lower support levels, indicating a struggle to gain sustained upward momentum.
7. FTSE Taiwan RIC Capped Index [5,6]
The FTSE Taiwan RIC Capped Index tracks the performance of bigger and medium-sized Taiwanese companies. The size of each company in the index is adjusted based on available shares and reviewed semi-annually. Unlike the FTSE Taiwan Index, which lets bigger companies have more control over the index’s movements, the capped index limits how much influence each company can have by capping each company’s influence at 20% of the index’s total value.
Major tech firms like Taiwan Semiconductor Manufacturing (TSMC), MediaTek, Hon Hai Precision Industry, and Quanta Computer are part of this index, which is mostly focused on the tech sector, accounting for 61.5% of its weight.
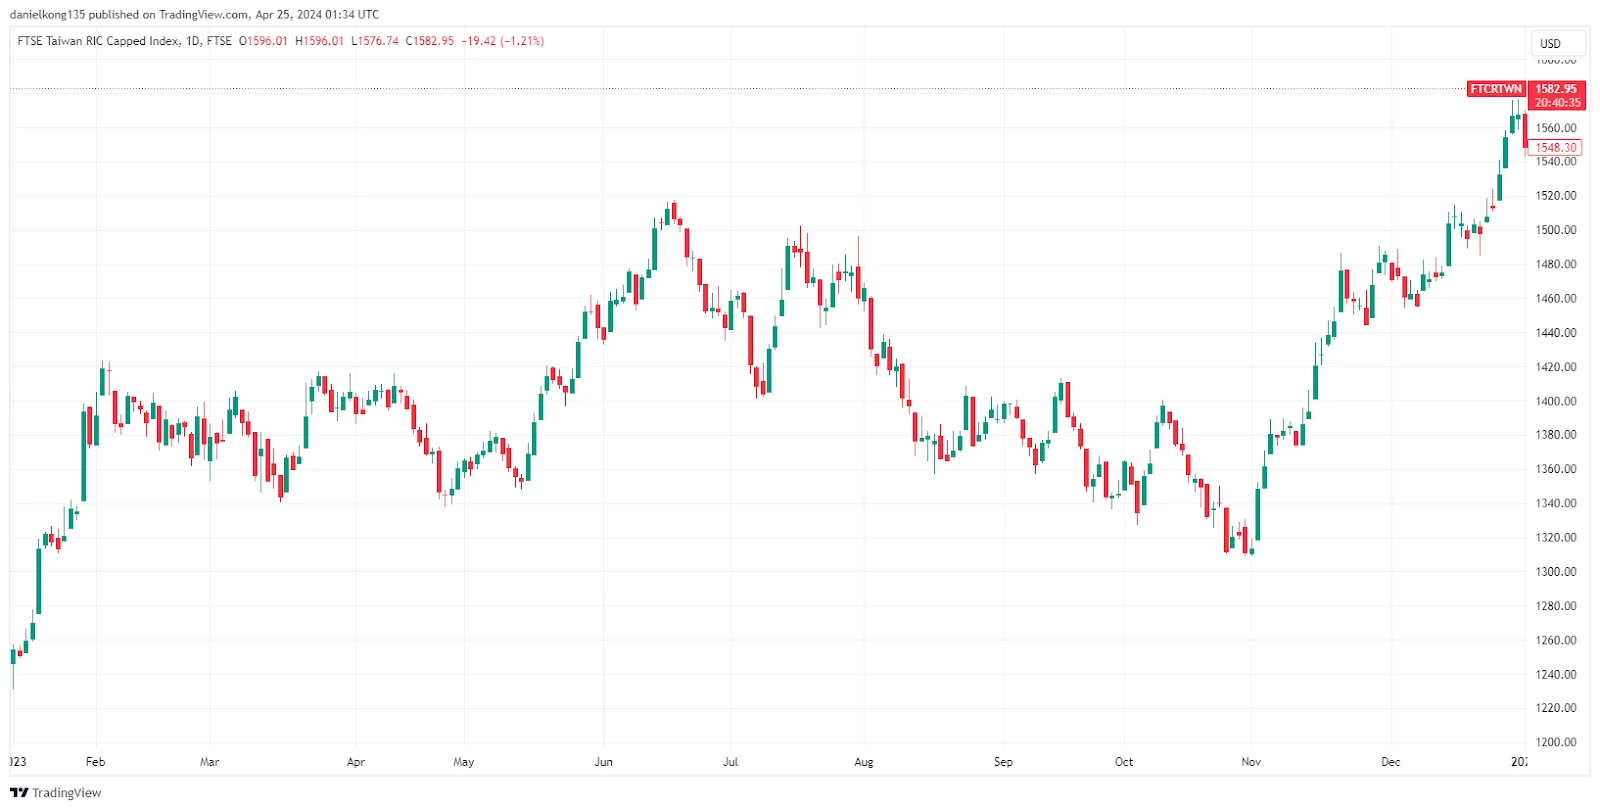
The FTSE Taiwan RIC Capped index chart depicts a year marked by significant ups and downs, highlighting a volatile market. However, in November 2023, the trend took a bullish turn. The surge in market capitalisation was mainly driven by growth in artificial intelligence (AI) and semiconductor stocks. Notably, Taiwan Semiconductor Manufacturing (TSMC) saw its market value soar by around NT$3.7 trillion. Similarly, IC designer MediaTek’s market capitalisation increased by NT$640 billion, and Quanta Computer, a leading AI server manufacturer, experienced a growth of NT$558.9 billion in market cap during the year.
Entering 2024, the FTSE Taiwan RIC Capped Index showed continued strength as the bullish sentiment from the previous year carried over, with investor optimism buoyed by the robust performance of the tech sector. The general upward trend was maintained for some time, suggesting underlying market confidence; however, by April, a sharper decline indicated a shift in investor sentiment.
How to Trade Indices
Now that you know which markets are moving, it is time to execute. Modern traders have three primary vehicles to gain exposure to major indices. However, your choice of instrument will dictate your speed, leverage, and ultimate profit potential.
Contracts for Difference (CFDs): The Active Trader’s Choice
If your goal is to actively capitalise on market volatility, CFDs are your most powerful tool. Instead of slowly accumulating shares, CFDs allow you to speculate purely on the price movement of major indices without the burden of owning the underlying assets.
- Profit in Any Direction: With CFDs, you are never restricted to a “buy and hold” strategy. You can instantly go long to profit from a market rally, or go short to make money during a market crash.
- Maximise Your Buying Power: CFDs utilise flexible leverage, allowing you to control massive market positions with only a small upfront margin deposit.
- The Catch: While leverage exponentially magnifies your profit potential, it also magnifies your risk. Executing CFDs requires a clear strategy and disciplined risk management (like strict stop-loss orders).
Ready to trade indices?
Don’t wait for a market recovery to make a profit. Open a live account with Vantage today to seize high-speed, bidirectional opportunities on the world’s most liquid indices.
Exchange Traded Funds (ETFs)
Exchange-Traded Funds (ETFs) offer a more traditional route to index exposure. Traded directly on the stock exchange just like individual company shares, an ETF is a basket of assets designed to passively replicate the performance of a specific index.
- The Benefit: ETFs are highly liquid, cost-efficient, and transparent. They allow you to buy into an entire market sector with a single transaction.
- The Drawback: ETFs require you to pay the full price of the share upfront (no leverage) and are generally designed for long-term holding rather than capturing fast-paced intraday volatility.
You do not need a separate traditional brokerage to build your portfolio. You can easily trade ETFs with Vantage alongside your CFD positions. This gives you seamless, centralised access to top global ETFs, allowing you to capture broad market movements or target niche sectors with competitive pricing and deep liquidity.
Mutual Funds
Mutual Funds pool money from thousands of investors to purchase a highly diversified portfolio that tracks an index. These are managed by professional fund managers whose goal is steady, long-term capital appreciation.
- The Drawback for Active Traders: Unlike CFDs or ETFs, which can be bought and sold instantaneously throughout the day, mutual funds are only priced and traded once at the end of the trading day. Combined with typically higher management fees, they are the slowest and least flexible way to access the market.
Learn all about the similarities and differences between mutual funds and ETFs with our comprehensive article.
How To Start Index Trading CFDs With Vantage: Step-By-Step Guide
- Open a Live Account: Sign up with Vantage and verify your account.
- Deposit Funds: Securely add funds to your trading account using multiple payment options.
- Analyse the Indices Market: Gain insights with Vantage’s advanced tools and charts to identify potential index CFDs to trade.
- Open & Monitor Your First Trade: Place your first order by speculating on the price movements of Index CFDs—buy (long) or sell (short).
- Close Your Position to Complete the Trade: Exit your trade to realise potential gains or manage risk.
Trade Major Indices with Vantage Today!
Major indices are more than just numbers on a screen—they are the most efficient way to track and trade the global financial markets. Rather than guessing which individual stock will perform best, trading indices allows you to capture the momentum of entire economies.
By adding indices to your strategy, you can:
- Instantly Diversify: Gain exposure to top-performing sectors with a single trade.
- Gauge Economic Health: Easily read the overall direction of the global markets.
- Trade Strategically: Capitalise on broad market trends or hedge your existing portfolio against volatility.
Ready to make your move?
Get the insights you need from Vantage Academy, and then put your strategy into action by opening your live Vantage account today.
References
- “S&P 500 Average Return – Investopedia”. https://www.investopedia.com/ask/answers/042415/what-average-annual-return-sp-500.asp. Accessed 2 Jan 2023.
- “DAX PERFORMANCE-INDEX – Yahoo! Finance”. https://finance.yahoo.com/quote/%5EGDAXI/history?p=%5EGDAXI. Accessed 4 Jan 2023.