


 Updated
In foreign exchange markets, prices can react quickly to economic data and headlines. Short bursts of volatility can widen spreads and increase slippage risk. In this setting, technical indicators still play an important role. They compress price and volume data into signals that traders can compare across timeframes. Many traders access these price movements through Contracts for Difference (CFDs), which track the price of an underlying market without requiring ownership of it.
Trading indicators, also known as technical indicators, are often treated as filters rather than as prediction tools. Many indicators are lagging by design, which makes them better suited for confirming conditions already present in the market. As trading indicators can sometimes produce conflicting signals, relying on a small, consistent toolkit is quite common.
Some traders combine two to four technical indicators that work well together. This approach can help reduce conflicting signals on crowded charts while limiting “analysis paralysis” caused by too many overlays.
Indicator choice often depends on holding time, trading style, and market structure. There is no single ‘best’ trading indicator, as effectiveness depends on market conditions, timeframe, and interpretation.
Ahead, we highlight technical indicators that commonly earn space on charts, explaining how indicators are typically grouped. Keep reading to discover the best trading indicators and how to use them.
This article is provided for general educational purposes only and should not be regarded as investment advice, a recommendation, or a solicitation to trade any financial instrument.
Key Points
- Trading indicators fall into four broad categories — trend, momentum, volatility, and volume — and most traders combine tools from more than one category rather than relying on a single one.
- No single indicator works best in every market condition; effectiveness depends on the timeframe used, the trading style applied, and whether the market is trending or ranging.
- A commonly referenced setup pairs one trend tool, one momentum tool, and one volatility tool, since stacking similar indicators tends to create overlapping rather than confirming signals.
4 Common Categories of Trading Indicators
The most widely referenced trading indicators include moving averages, the Relative Strength Index (RSI), MACD, Bollinger Bands, Average True Range (ATR), the Average Directional Index (ADX), the Stochastic Oscillator, the Ichimoku Cloud, standard deviation, and Fibonacci retracement. These tools fall into several broad categories based on what aspect of price behaviour they measure:
- Trend indicators track the current trend and market direction.
- Momentum indicators measure the speed and strength behind a price move.
- Volatility indicators show how widely price movement can swing.
- Volume tools are often referenced to assess participation during breakouts or reversals.
Such categories can help traders of all levels understand what type of information an indicator provides before adding it to a chart. Many traders often combine technical indicators from different groups to build a more balanced, overall view of the markets.
| Indicator | Category | What It Measures |
| Moving Averages (EMA / SMA) | Trend | Trend direction via smoothed price movement |
| Average Directional Index (ADX) | Trend | Strength of a trend, not its direction |
| MACD | Trend | Momentum shifts between two moving averages |
| Relative Strength Index (RSI) | Momentum | Speed and strength of price moves; overbought / oversold |
| Stochastic Oscillator | Momentum | Closing price relative to a recent high-low range |
| Average True Range (ATR) | Volatility | Average size of recent price movement |
| Bollinger Bands | Volatility | Price dispersion around a moving average |
| Ichimoku Cloud | Trend + Momentum | Trend bias, momentum and dynamic support / resistance |
| Standard Deviation | Volatility | Statistical spread of prices from their average |
| Fibonacci Retracement | Other | Potential pullback and support / resistance zones |
Table 1: Trading Indicators by Category
3 Best Trend Indicators for 2026
In 2026, many forex charts still rely on classic trend indicators. These tools remain common because they are built into most platforms and widely studied. They also compress raw price movement into clearer summaries.
Trend indicators are often described as filters. They describe what price has been doing using past data. Moving averages smooth price movement, MACD compares two averages to highlight momentum shifts, and ADX measures trend strength without indicating direction.

Image 1: Best trend indicators
1. Moving Averages: Exponential Moving Average (EMA) and Simple Moving Average (SMA)
A Moving Average (MA) is a rolling average of past prices. It smooths market noise and can help describe trend direction. A rising MA often aligns with an uptrend view, while a falling MA aligns with a downtrend view.
Many chart methods also treat a moving average as a dynamic area where pullbacks may pause. The Exponential Moving Average (EMA) and Simple Moving Average (SMA) differ mainly in sensitivity. An EMA gives more weight to recent prices, so it reacts faster. An SMA weights prices evenly, so it reacts more slowly.
Two of the most widely referenced moving averages are the Simple Moving Average (SMA) and the Exponential Moving Average (EMA). As noted earlier, an EMA responds more quickly to recent price movements.
An SMA lags more on higher timeframes and has a cleaner appearance. In practice, moving averages are widely used as trend indicators. Charts generally show upward pressure when price remains above an MA.
If the price remains below an MA, charts are often interpreted as bearish. The slope of the moving average also matters. A rising MA suggests strengthening trend conditions, while a flattening MA may indicate consolidation.
Moving averages can also act as dynamic support and resistance. During trends, price often pulls back towards a key MA before continuing. Common reference levels include the 20-, 50-, and 200-period moving averages. Shorter settings, such as 9 and 20, are also common on intraday charts.
Another widely discussed method is the moving average crossover concept. This compares a fast MA with a slower MA to identify potential shifts in market regime. Even so, crossovers can produce misleading signals in ranging markets. That’s why many traders combine them with price structures such as swing highs and swing lows.
As moving averages use past data, they can lag during sharp news-driven moves. Sideways price action can also cause ‘whipsaw’ signals and mixed readings.
Key features:
- Smooths price data to reveal the underlying trend direction
- Available as both Simple (SMA) and Exponential (EMA) variants with different responsiveness to recent prices
- Can act as a dynamic support or resistance area while a trend is intact
- Commonly combined into crossover pairs, such as a 9-period and 20-period MA, to flag potential shifts
- Lags during sharp, news-driven price moves and can produce whipsaw signals in sideways markets
2. Average Directional Index (ADX)
Average Directional Index (ADX) measures trend strength on a scale of 0 to 100. It’s non-directional, meaning that it does not indicate whether a trend is moving up or down.
Developed by J. Welles Wilder, ADX is often used to help assess whether a market is trending or ranging. It’s commonly analysed alongside the Directional Movement indicators, +DI (Plus Directional Indicator) and -DI (Minus Directional Indicator), for potential momentum changes and provide directional context.
Together, these tools help traders evaluate whether a trend may be strengthening or weakening.
ADX is generally considered a market condition indicator.
Lower readings typically occur during ranging or choppy market conditions. Higher readings are more common when trends gain momentum. One of the most widely referenced configurations is ADX (14).
- Readings around 15–20 are generally treated as a weak-trend signal on most charting platforms.
- Readings above 20-25 are commonly associated with more robust follow-through.
ADX is often used in conjunction with an indicator to determine trend direction. For example, a moving average may show the trend direction, while ADX provides context about its strength. During periods when ADX spikes, trends may appear more organised. When ADX declines, the quality of breakouts may weaken.
Like most technical indicators, ADX is lagging because it’s based on historical price data. Sudden news events can cause rapid price spikes that the indicator may reflect only after the move has occurred.
Key features:
- Measures trend strength on a 0 to 100 scale without indicating direction
- Often paired with the +DI and -DI lines for directional context
- Readings above roughly 20 to 25 are commonly associated with stronger trend follow-through
- Works best alongside a directional tool, such as a moving average, rather than on its own
- Lags because it is calculated from historical price data
3. Moving Average Convergence Divergence (MACD)
MACD stands for Moving Average Convergence Divergence, developed by Gerald Appel in the late 1970s. It’s built from two Exponential Moving Averages and compared against a signal line. Because it tracks both direction and momentum, MACD is typically used to confirm trend strength and identify momentum shifts.
The MACD line reflects the gap between a fast and slow EMA. A signal line smooths the MACD line while the histogram shows the distance between them.
The five common analytical frameworks referenced with Moving Average Convergence Divergence include:
- Zero-Line Bias: When MACD is above the zero line, it’s often interpreted as bullish bias. When MACD is below zero, it may indicate bearish momentum. This framework helps align analysis with the broader trend.
- Signal-Line Crossover (With Context): Signal-line crossovers are often described as momentum shifts. Traders sometimes combine them with price structure or moving averages to assess whether momentum supports a price move.
- Histogram Pullback Timing: During pullbacks, histogram bars may contract as momentum slows. When momentum returns, these bars often expand again. As such, traders monitor both the direction and the size of the histogram bars.
- MACD Divergence: Divergence compares swings in price with swings in the MACD indicator. It’s typically viewed as a warning signal rather than a guaranteed reversal.
- MACD + Strength Filter: MACD readings are sometimes reviewed alongside the Average Directional Index (ADX) to assess trend strength within broader market analysis.
Next, let’s explore how MACD can be used in technical analysis for forex traders.
In market notes, MACD is often read in three primary ways:
- First, the zero line acts as a directional bias marker. Values above zero suggest the fast EMA is leading the slower one.
- Second, signal-line crossovers are interpreted as momentum shifts rather than certainties.
- Third, histogram contraction and expansion are used to describe pullbacks and renewed momentum within a trend.
The most widely cited MACD settings on many platforms are (12, 26, 9). As MACD is based on averages, it can lag during strong moves and may produce choppy signals during range-bound markets.
Key features:
- Combines two Exponential Moving Averages with a signal line to track momentum shifts
- Uses the zero line, signal-line crossovers, and histogram size as three distinct reading frameworks
- Default settings of 12, 26, and 9 are widely used across charting platforms
- Can highlight divergence between price direction and underlying momentum
- May produce choppy, lower-conviction signals in range-bound markets
The 2 Best Momentum Indicators for 2026
While trend indicators describe direction, momentum indicators help traders assess whether a move is strengthening, weakening, or losing pace. Two widely referenced momentum indicators are the Relative Strength Index (RSI) and the Stochastic Oscillator.
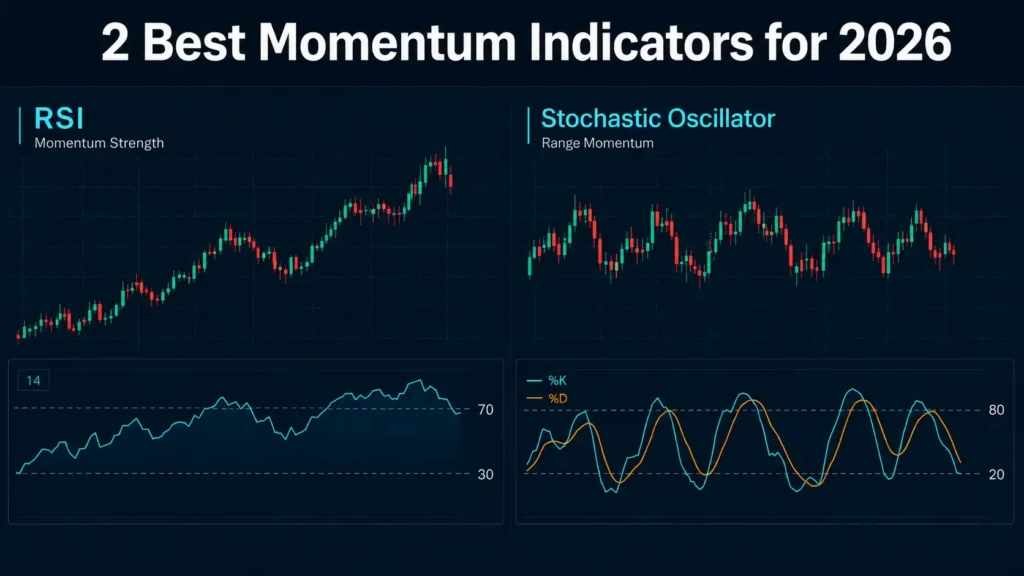
Image 2: Best momentum indicators
1. Relative Strength Index (RSI)
The Relative Strength Index (RSI) is a momentum oscillator introduced by J. Welles Wilder Jr. It tracks recent gains versus losses on a 0–100 scale. A 14-period setting and the 70/30 reference levels are commonly cited.
High readings are often linked with strong upward momentum, while lower readings are typically associated with stronger downward momentum. An RSI reading of 70 or above is often described as an overbought condition. Meanwhile, an RSI reading below 30 is often described as oversold.
RSI is also discussed in terms of divergence, where price and the RSI indicator move in different directions. In strong trends, RSI can remain elevated or depressed for extended periods.
Key features:
- Tracks recent gains versus losses on a 0 to 100 scale
- Commonly uses 70 and 30 as overbought and oversold reference levels
- A 14-period setting is the most widely cited default
- Can highlight divergence between price action and underlying momentum
- May remain at extreme readings for extended periods during strong trends
2. Stochastic Oscillator
The Stochastic Oscillator was developed by George Lane in the late 1950s. It compares the closing price to a recent high-low range. As both RSI and the Stochastic Oscillator highlight conditions where price may be stretched, they are often referenced in discussions of mean reversion in range-bound markets.
The Stochastic Oscillator generates two lines:
- %K (the main line), and
- %D (a smoothed signal line)
Readings near 80 are often referred to as ‘overbought’, while readings near 20 are considered ‘oversold’. In reality, however, these zones are most useful as context rather than as guaranteed turning points.
Stochastics can be particularly useful in range-bound markets with clear support and resistance levels. In such conditions, signals near the extremes of %K and %D may suggest weakening momentum. In strong trending markets, however, the oscillator can remain near overbought or oversold levels for extended periods, making overall trend context important.
Key features:
- Compares the closing price to a recent high-low trading range
- Plots two lines, %K and %D, to generate readings
- Commonly uses 80 and 20 as overbought and oversold reference zones
- Tends to work well in range-bound markets with defined support and resistance
- Can stay at extreme levels during strong trends, which reduces its reliability in those conditions
The 2 Best Volatility Indicators
While momentum indicators measure speed, volatility tools help traders assess how active or quiet market conditions may be. Here are two widely popular volatility indicators to explore in detail:

Image 3: Best volatility indicators
1. Average True Range (ATR)
Average True Range (ATR) is a volatility measure, once again introduced by J. Welles Wilder Jr. It tracks the “true range” of price and averages it over a set period.
Because ATR reflects recent price movement, it’s often referenced when discussing position sizing. ATR can also help describe whether recent price candles are relatively large or small.
When ATR rises, intraday price swings often become larger, and ‘normal’ pullbacks can travel farther. When ATR declines, markets tend to consolidate, and follow-through can be thinner.
ATR is often referenced to contextualise relative price movement and recent volatility when reviewing historical market behaviour. Specific parameters and applications vary widely and are not prescriptive.
ATR can also explain when market conditions appear unusually quiet. A very low ATR reading can indicate slower trading sessions in which breakouts may lack momentum.
Key features:
- Measures the average true range of price movement over a set period
- A 14-period setting is the most widely referenced default
- Often used to contextualise position sizing relative to recent volatility
- Rising readings point to larger price swings; falling readings point to consolidation
- Does not indicate market direction, only the scale of recent movement
2. Bollinger Bands
Bollinger Bands were developed by John Bollinger in the early 1980s. They consist of a middle Simple Moving Average and two outer bands based on standard deviation. The width of the bands expands and contracts as market volatility changes.
In forex market analysis, Bollinger Bands are often referenced in two main ways. First, they can help describe range conditions. If price moves above or below the middle band and then back towards it, analysts sometimes assume it is reverting to its mean.
Second, Bollinger Bands can help identify cycles of volatility expansion and contraction. A prolonged band squeeze—when bands become very narrow—can be an early indication of a low-volatility phase that may later transition into a larger price move (on occasion).
After considerable expansion, the middle band often becomes a reference point for trend direction. Price remaining above the middle band may signal bullish price action, while price staying below the middle band may point to bearish price action.
However, band breaks do not necessarily signal reversals. During strong trends, price can continue to move along the outer band, a behaviour sometimes described as “walking the band”.
Key features:
- Plots a moving average with two outer bands set using standard deviation
- Band width expands and contracts as market volatility changes
- A prolonged band squeeze can signal a forthcoming shift in volatility
- Price can continue moving along an outer band during strong trends, a pattern often called “walking the band”
- Reads best alongside a trend or momentum tool rather than in isolation
The Best All-in-One Indicator Forex Traders Can Consider
In technical analysis, an ‘all-in-one’ indicator typically combines several analytical elements into a single view. It often brings together trend, momentum, and volatility signals on the same chart.
This can make market conditions easier to compare across currency pairs and timeframes.
Most indicators are mathematically derived from past prices, so they describe existing conditions rather than predict outcomes.

Image 4: Best all-in-one indicator
Ichimoku Cloud (Ichimoku Kinko Hyo): Trend + Momentum + Levels
Ichimoku (often called the Ichimoku Cloud) is a full charting system. It plots five lines, along with a shaded ‘cloud’ that maps dynamic support and resistance. It also provides a framework for identifying trend bias based on where the price sits relative to the cloud.
The five main components of Ichimoku are:
- Tenkan-sen and Kijun-sen, which act as short- and medium-term trend lines.
- Senkou Span A and Senkou Span B form the Kumo (the cloud), which is often treated as a dynamic support and resistance zone.
- Chikou Span is a lagging line that plots past closing prices.
The classic default settings are 9, 26, and 52, which many trading platforms keep as standard.
In chart commentary, price above the cloud indicates bullish bias, while price below the cloud is associated with a bearish bias. When price moves inside the cloud, market conditions are often viewed as mixed or range-like. Common signal ideas include cloud breaks, Tenkan-Kijun crosses, and Kijun pullbacks.
Take note that Ichimoku is built from historical prices, which means it can lag during sharp news-driven moves and may produce mixed reads during tight ranging markets.
Key features:
- Combines five lines into a single charting system covering trend, momentum, and key levels
- The shaded cloud (Kumo) maps a dynamic support and resistance zone
- Default settings of 9, 26, and 52 are standard across most charting platforms
- Price position relative to the cloud is commonly used to read trend bias
- Has more moving parts to interpret than single-line indicators, which adds to the learning curve
2 Other Types of Trading Indicators
Beyond trend, momentum, and volatility indicators, traders also reference other analytical tools that help interpret price behaviour. These tools often provide additional context rather than standalone signals.
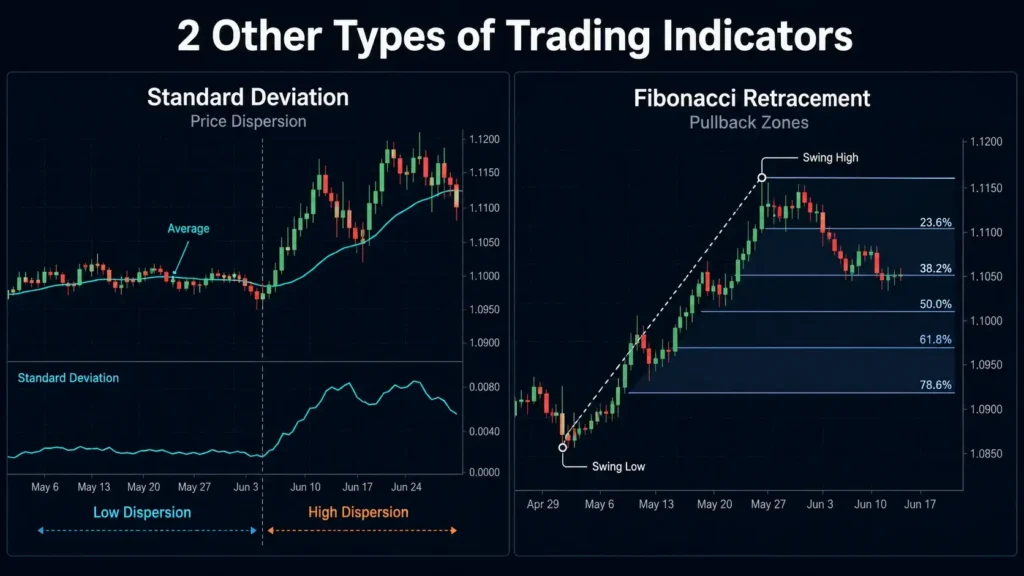
Image 5: Other types of trading indicators
1. Standard Deviation
Standard deviation is a basic statistical measure that shows how widely prices are spread from an average.
In trading terms, it’s commonly described as a volatility measure. When price remains in a tight range, standard deviation tends to stay low. When price swings widen, standard deviation usually increases.
Standard deviation also appears within several popular indicators. For example, Bollinger Bands are built around a moving average, with the outer bands set using standard deviation. This relationship helps explain why the bands contract during quieter markets and expand during more active periods.
Key features:
- Measures how widely prices are spread from their average over a set period
- Rises as price swings widen and falls as price action tightens
- Forms the mathematical basis for the outer bands used in Bollinger Bands
- Useful for comparing relative volatility across different instruments or timeframes
- Does not indicate market direction on its own
2. Fibonacci Retracement
Fibonacci Retracement is a charting method used to map potential pullback zones. It’s built from common ratios linked to the Fibonacci sequence.
On most platforms, the tool plots horizontal levels between a swing low and a swing high.
The levels most often referenced are 23.6%, 38.2%, 50.0%, 61.8%, and 78.6%. In market analysis, these levels are usually treated as zones rather than exact prices. They are often compared with support and resistance levels as well as visible swing structures.
This guide to Fibonacci retracement covers how the levels are drawn and applied in more depth.
As the swing points are chosen by the analyst, results can differ across charts. This subjectivity is one reason why Fibonacci tools are commonly used alongside other indicators or price-based signals.
Key features:
- Maps potential pullback zones using ratios drawn from the Fibonacci sequence
- Commonly plotted at 23.6%, 38.2%, 50.0%, 61.8%, and 78.6% between a swing low and a swing high
- Levels are typically treated as zones rather than exact prices
- Swing point selection is subjective, so results can differ between analysts on the same chart
- Usually combined with other indicators or price-based signals for confirmation
How to Choose Different Indicators for Your Trading Style
Use this simple checklist:
- Do you trade trends or reversals most often?
- Do you rely on structured entry and exit frameworks?
- Do you rely on support and resistance levels for entries?
- Do you want fewer trades or more trading opportunities?
Here are two more tips for traders to consider:
- Use indicators as a supplement to price action, not a substitute. (Check out our guide on “The Basics of Price Action & Indicators”.)
- Avoid using two indicators that measure the same thing.
Last but not least, keep in mind that a clean setup often includes:
- One trend tool
- One momentum tool
- One volatility tool
This combination is typically sufficient for many trading approaches.
Key Takeaways on Using Trading Indicators
Trading indicators are mathematical tools built from past market data. In technical analysis, they are used to describe trend, momentum, or volatility.
Many popular indicators are lagging by design, meaning they often confirm conditions already visible on the chart. As a result, indicators tend to work best as filters and risk guides rather than as standalone signals.
Market regimes also matter. During trending phases, trend indicators may appear cleaner and easier to interpret. In ranging phases, repeated signals and whipsaws are more common. At the same time, volatility shifts can alter what ‘normal’ price movement looks like. Standard deviation is one way volatility is commonly described in trading analysis.
Indicator settings and timeframe also influence the story. Faster settings react more quickly to price chances, while slower settings smooth out more noise. As a result, the same indicator may look ‘right’ on one chart and messy on another. That’s why many trading toolkits remain small. Using only a few tools with different roles can help reduce conflicting signals.
Finally, indicator rules are often reviewed through backtesting, which simulates trading rules on historical data to study behaviour and limitations. Traders may also choose to practise applying indicators in a simulated environment using demo trading functionality before participating in live markets.
FAQs
What are trading indicators?
Trading indicators are charting tools that use price, time, and sometimes volume to show trend, momentum, volatility as well as possible entry and exit points. They can help traders confirm what price is doing but not predict the future.
What are the best trading indicators used on popular trading platforms?
On many charting platforms, commonly used indicators include Moving Averages (EMA/SMA), RSI, MACD, Bollinger Bands, ATR, and ADX, which are typically available as built-in chart tools. These indicators help to cover trend, momentum, volatility, and risk sizing in a simple setup.
What are the most reliable indicators for forex trading?
There is no universally reliable indicator. Instead, indicators commonly referenced across forex charts include EMA, RSI, ATR, and ADX, depending on the timeframe and market conditions. These tools are used to describe market behaviour rather than predict outcomes.
Which indicator is best for trading?
There is no single best trading indicator, since the right choice depends on timeframe, trading style, and current market conditions. Trend indicators such as moving averages and ADX tend to suit trending markets, while momentum tools such as RSI and the Stochastic Oscillator are more commonly referenced in range-bound conditions. Many traders pair one trend, one momentum, and one volatility indicator rather than relying on a single tool for every market environment.
Which indicators are best for day trading?
Day traders commonly reference faster-reacting tools such as shorter-period moving averages, RSI, and Average True Range (ATR), since these can respond more quickly to intraday price swings than longer-period settings. ATR in particular is often used to gauge how much a market is moving within a session, which can inform position sizing. As with any timeframe, no single indicator guarantees results, and many day traders combine two or three tools to confirm signals before acting on them.
RISK WARNING: CFDs are complex financial instruments and carry a high risk of losing money rapidly due to leverage. You should ensure you fully understand the risks involved and carefully consider whether you can afford to take the high risk of losing your money before trading.
Disclaimer: The information is provided for educational purposes only and doesn’t take into account your personal objectives, financial circumstances, or needs. It does not constitute investment advice. We encourage you to seek independent advice if necessary. The information has not been prepared in accordance with legal requirements designed to promote the independence of investment research. No representation or warranty is given as to the accuracy or completeness of any information contained within.
This material may contain historical or past performance figures and should not be relied on. Furthermore, estimates, forward-looking statements, and forecasts cannot be guaranteed. The information on this site and the products and services offered are not intended for distribution to any person in any country or jurisdiction where such distribution or use would be contrary to local law or regulation.