As of 3 March 2026, the global energy market is facing its most significant supply challenge in decades. Following recent geopolitical escalations in the Middle East, commercial vessel traffic through the Strait of Hormuz has effectively ground to a halt. With major shipping lines suspending transits, approximately 20 million barrels of oil—representing nearly 20% of global daily consumption—are currently at risk of being stranded or delayed [1].
Often described as the “jugular vein” of the global energy market, the Strait of Hormuz is a narrow waterway connecting the Persian Gulf with the Gulf of Oman and the Arabian Sea. It is the primary exit point for crude oil and liquefied natural gas (LNG) from the world’s most prolific producers. For traders, this chokepoint is not just a geographic feature but a primary driver of price action, where geopolitical tension translates directly into market volatility.
In this current high-stakes environment, oil prices have already shown sharp reactions, with Brent crude gapping higher as the “fear premium” returns to the forefront. Understanding the mechanics of this chokepoint is essential for traders looking to navigate the oil markets during periods of heightened volatility.
Key Points
- The Strait of Hormuz is a critical oil chokepoint, so any disruption there can quickly push oil prices higher and increase market volatility.
- In March 2026, rising geopolitical tension, falling ship traffic, and higher insurance costs added a strong fear premium to Brent and WTI prices.
- Oil CFDs allow traders to respond to both rising and falling markets, but the high volatility makes risk management especially important.
Why the Strait of Hormuz Moves Oil Prices
The Strait of Hormuz serves as the ultimate bottleneck for the global energy trade. When tensions escalate in this region, the fundamental law of supply and demand dictates price action.
However, in the world of commodities trading, the anticipation of a supply crunch is often as impactful as the physical disruption itself. This phenomenon is known as the “Fear Premium.”
The “Fear Premium” and Market Sentiment [2]
Prices often spike before a single barrel of oil is actually lost. This is because market participants factor in the risk of future shortages. As of March 2026, we are seeing this premium reflected in the bid-ask spreads and the rapid appreciation of crude futures. Traders often monitor how market volatility evolves during periods of uncertainty, including developments around the duration of the blockade or the likelihood of a diplomatic resolution.
A primary driver of this premium is the skyrocketing cost of maritime insurance. According to recent reports from the Financial Times, marine insurers have begun issuing 48 to 72-hour cancellation notices for existing policies, effectively forcing shipowners to renegotiate coverage under “war risk” terms.
These rising overheads act as a floor for oil prices; even if physical supply remains steady, the “cost of carry” ensures that Brent and WTI remain elevated. The impact on the ground (and at sea) is significant:
- Surging War Risk Premiums: In just one week, war risk premiums for vessels transiting the Strait have jumped by over 60%. Rates that previously sat at 0.125% of a ship’s replacement value have climbed to between 0.20% and 0.40%, with some quotes for affiliated vessels reaching as high as 0.70%.
- Escalating Per-Voyage Costs: For a standard Very Large Crude Carrier (VLCC) valued at USD100,000,000, a single transit now carries an insurance tag of approximately USD375,000—a sharp increase from the previous USD250,000.
- Per-Barrel Price Impact: These costs trickle down to the market immediately. On a per-barrel basis, insurance-related costs for shipping Saudi crude to Asian markets have reportedly risen from USD0.25 to nearly USD0.80 overnight.
Brent vs. WTI: Understanding the Global Benchmark Gap
For those trading on oil, recognising the distinction between Brent Crude and West Texas Intermediate (WTI) is essential. Although the two benchmarks often move in the same direction, their reactions to geopolitical developments in the Middle East can vary considerably.
| Feature | Brent Crude | WTI (West Texas Intermediate) |
| Origin | North Sea (Global benchmark) | United States (Domestic benchmark) |
| Sensitivity | High: Directly impacted by Middle East tensions and shipping routes. | Moderate: More reflective of US domestic production and inventories. |
| Global Benchmark | Regarded as the international global benchmark for crude oil prices | Acts as a crucial benchmark within the US and is slowly gaining influence on the global stage |
Table 1: Comparison between Brent and WTI.
To further illustrate how these two crude oil benchmarks differ in pricing and global influence, the following video provides a clear visual explanation of the relationship between Brent Crude and WTI.
Current Market Drivers for Oil
The volatility witnessed in the first quarter of 2026 is driven by a complex interplay of geopolitical escalation, strategic energy stockpiling, and the carefully calibrated responses of global oil cartels.
Regional Tensions and the “De Facto” Closure
As of March 2026, the US-Israel-Iran conflict has transitioned from a localised skirmish to a direct threat to global shipping. This has triggered a de facto closure as over 150 tankers have dropped anchor in open waters, unwilling to risk transit without insurance coverage.
This stand-off has immediate consequences for oil pricing. The uncertainty regarding how long these vessels will remain stranded acts as a high-velocity catalyst for intraday price swings.
The OPEC+ Balancing Act
In a move to stabilise the market, eight key members of OPEC+ (including Saudi Arabia and the UAE) met virtually in March 2026. Despite previous plans to pause production increases, the group agreed to a production adjustment of 206,000 barrels per day (bpd) starting in April 2026 [3].
Key takeaways for traders include:
- Signalling over Volume: While 206,000 bpd is relatively small compared to a 100 million bpd global market, it signals that OPEC+ may use its spare capacity as part of efforts to stabilise the oil market.
- Spare Capacity Realities: Analysts at Rystad Energy note that effective spare capacity stands at roughly 3.5 million bpd [4]. However, this “paper capacity” offers little relief if the physical export routes through the Strait remain blocked.
As of 2 March 2026, US crude rose 8.4% ($5.72) to $72.74 per barrel, while Brent increased 9% ($6.65) to $79.45, following reports that Iran had closed the Strait of Hormuz [5].
How to Trade Oil CFDs During Volatility
Trading oil during a geopolitical crisis requires a blend of fundamental awareness and strict discipline. Oil contracts for difference (CFDs) allow traders to speculate on the price movements of Brent and WTI without owning the underlying physical barrels.
However, the high-velocity nature of the 2026 energy market means that understanding the mechanics of your trade is just as important as the trade itself.
Leverage and Risk Management
In CFD trading, leverage allows you to control a large position with a relatively small amount of capital (margin). While this can enhance the ability to engage with market movements in an elevated oil price environment, it also carries a higher level of risk.
In the current volatile environment, a sudden de-escalation—such as a surprise diplomatic breakthrough or the reopening of the Strait—can cause prices to “gap” downwards. Because leverage magnifies both gains and losses, a sharp reversal could lead to losses that exceed your initial deposit if proper risk management, such as Stop Loss orders, is not in place.
Directional Trading: Long vs. Short
A key feature of CFDs is the flexibility to trade in both rising and falling markets, allowing traders to adapt as geopolitical headlines shift:
- Going Long (Buying): A long position is typically used when a trader expects the price of an asset to rise. This is a speculation on continued supply constraints.
- Going Short (Selling): A short position allows traders to speculate on potential price declines. This represents a position taken in anticipation of a potential price decline.
Hedging Against Real-World Energy Costs
Some market participants use derivatives to manage exposure to commodity price movements. When a critical chokepoint like the Strait of Hormuz is disrupted, the subsequent spike in crude prices often leads to higher costs at the petrol pump and increased operational expenses for businesses.
However, CFD trading carries significant risk and may not be suitable for all traders. Market outcomes are uncertain and trading results cannot be guaranteed.
Traders should ensure they fully understand the risks involved before participating in leveraged markets.
Technical Tools for Geopolitical Trading
While geopolitical headlines provide the fundamental “why” behind price movements, technical indicators help traders navigate the “how” and “when.” In a high-velocity market driven by news from the Strait of Hormuz, these tools act as a compass to help you quantify risk and identify potential entry or exit points.
Measuring Volatility with the Average True Range (ATR)
Geopolitical crises often lead to “noisy” markets characterised by erratic price swings. The Average True Range (ATR) is a technical indicator used to measure market volatility by decomposing the entire range of an asset price for a given period.
The chart below provides an example of how this indicator responds to sudden geopolitical shifts.
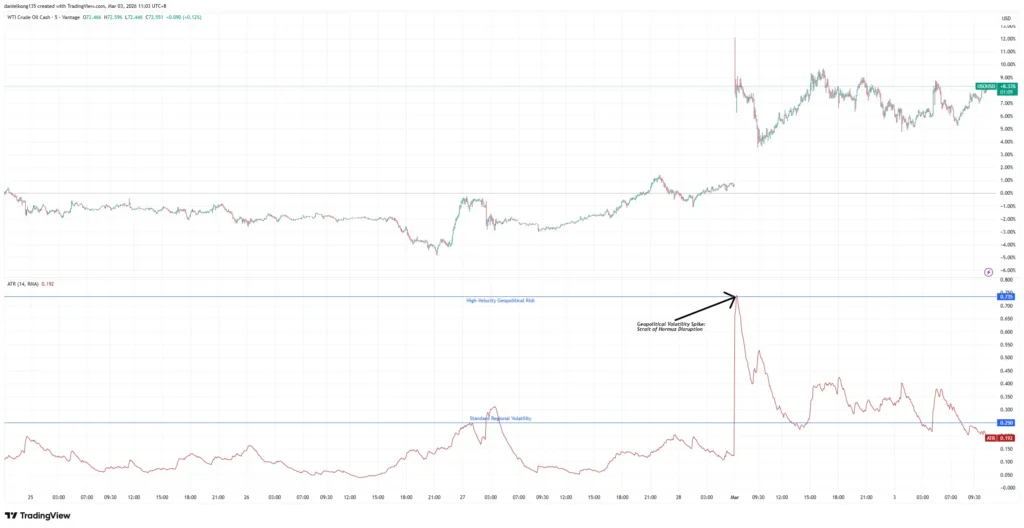
Chart 1: WTI Crude Oil Cash showing ATR volatility spikes. Source: https://www.tradingview.com/x/y1KT5rEK/
Instead of indicating the direction of the trend, the ATR measures the “width” of the volatility. For example, if the ATR on Brent Crude rises significantly in March 2026, it suggests that the average daily price move is becoming larger.
How traders use it:
- Setting Stop Losses: In highly volatile markets, prices can “whipsaw.” Traders often use a multiple of the ATR to set wider Stop Loss orders, helping to ensure they are not prematurely knocked out of a position by temporary market noise.
- Position Sizing: When the ATR is high, traders may choose to reduce their position size to account for the increased risk per pip.
Identifying Support and Resistance Levels
Psychological levels often act as invisible barriers where buying or selling pressure tends to concentrate. In the context of the current oil supply concerns, these levels represent the “collective memory” of the market.
- Resistance Levels (The Ceiling): These are price points where selling interest historically outweighs buying pressure, preventing the price from rising further.
- Support Levels (The Floor): These are levels where buying interest tends to increase as traders perceive the price to be relatively low. If diplomatic tensions ease, these are the areas where the market may find a base.
By combining the ATR’s measure of volatility with established support and resistance zones, traders can create a more structured framework for navigating the rapid shifts in oil prices.
Navigating Volatility with a Strategic Trading Plan
The Strait of Hormuz remains the most critical barometer for global energy stability. As we have seen in March 2026, the intersection of physical blockades, skyrocketing insurance premiums, and shifting OPEC+ policies creates a high-velocity trading environment.
While these conditions can create significant market volatility, they also require a disciplined approach to risk management. Geopolitical volatility can vanish as quickly as it appears, making a robust trading plan—complete with technical indicators like the ATR and clear support/resistance levels—an absolute necessity.
Whether used for hedging against rising costs or speculating on intraday price movements, exposure management remains a fundamental component of the trading process.
To explore how oil CFDs work in a trading environment, you may consider opening a demo account with Vantage to practise in simulated market conditions. If you decide to trade with real capital, you may also. Open a live account with Vantage, subject to eligibility and applicable laws.
FAQ
1. What is the Strait of Hormuz?
The Strait of Hormuz is the world’s most strategically important oil chokepoint. It is a narrow waterway through which approximately 20% of the global liquid petroleum consumption and 20% of global liquefied natural gas (LNG) passes daily, making it vital for international energy security.
For traders, disruption to this transit route may contribute to increased volatility in Brent and WTI crude prices due to the sudden tightening of global supply. Consequently, the strait is a primary focus for those monitoring market price action driven by geopolitical volatility.
2. Where is the Strait of Hormuz?
The Strait of Hormuz is located in the Middle East, functioning as the only maritime corridor connecting the Persian Gulf to the Gulf of Oman and the Arabian Sea. It serves as a physical gateway between Iran to the north and the Musandam Peninsula (Oman) and the United Arab Emirates to the south.
3. Who controls the Strait of Hormuz?
The strait is composed of the territorial waters of Iran and Oman. While these nations exercise maritime sovereignty, the United Nations Convention on the Law of the Sea (UNCLOS) provides for “transit passage,” allowing international vessels to navigate the strait for continuous and expeditious transit.
As of early March 2026, this international legal framework is under severe strain. According to reports cited by Al Jazeera, following military strikes by the US and Israel on 28 February, a senior advisor to Iran’s Islamic Revolutionary Guard Corps (IRGC) stated that the Strait could be considered “closed” to commercial traffic and warned that vessels attempting to pass could face military retaliation [6].
4. Did Iran close the Strait of Hormuz?
While Iran has historically used the threat of closure as a geopolitical lever, the situation has shifted into an active crisis. On 2 March 2026, a senior advisor to the Iranian Revolutionary Guard Corps (IRGC) announced the closure of the Strait of Hormuz, stating that vessels attempting transit would face military repercussions.
For those monitoring oil prices, this has resulted in a substantial decrease in maritime traffic. Data indicates that daily transits through the strait dropped from an average of 130 vessels to near zero.
5. How does the Strait of Hormuz closure affect oil prices?
A disruption in the strait immediately restricts global supply, leading to a rapid increase in oil prices. Beyond physical shortages, the market price usually incorporates a “fear premium,” reflecting the risk of prolonged instability, which drives high volatility in Brent and WTI benchmarks.
6. How do insurance costs impact my oil trades?
Increased geopolitical risk leads to higher “war risk” insurance premiums for tankers. These rising overheads increase the total cost of transporting crude oil. For traders, these costs act as a fundamental price floor, often keeping oil prices elevated even if a physical supply shortage has not yet fully developed.
RISK WARNING: CFDs are complex financial instruments and carry a high risk of losing money rapidly due to leverage. You should ensure you fully understand the risks involved and carefully consider whether you can afford to take the high risk of losing your money before trading.
Disclaimer: The information is provided for educational purposes only and doesn’t take into account your personal objectives, financial circumstances, or needs. It does not constitute investment advice. We encourage you to seek independent advice if necessary. The information has not been prepared in accordance with legal requirements designed to promote the independence of investment research. No representation or warranty is given as to the accuracy or completeness of any information contained within. This material may contain historical or past performance figures and should not be relied on. Furthermore estimates, forward-looking statements, and forecasts cannot be guaranteed. The information on this site and the products and services offered are not intended for distribution to any person in any country or jurisdiction where such distribution or use would be contrary to local law or regulation.
Reference
- “What is the strait of Hormuz and why is it crucial for oil supplies? – The Guardian” https://www.theguardian.com/business/2026/mar/01/us-israel-strikes-iran-oil-price Accessed 3 March 2026
- “Insurers to cancel policies and raise prices for ships in Gulf and Strait of Hormuz – Financial Times” https://www.ft.com/content/2dc114d0-5bb3-4fae-b538-9a050954549a Accessed 3 March 2026
- “OPEC+ to boost oil production 206,000 bpd as Iran conflict threatens supply – World Oil” https://www.worldoil.com/news/2026/3/1/opec-to-boost-oil-production-206-000-bpd-as-iran-conflict-threatens-supply Accessed 3 March 2026
- “Rystad Energy: OPEC+ announces crude production increase following US-Israel strikes on Iran – World Pipelines” https://www.worldpipelines.com/business-news/02032026/rystad-energy-opec-announces-crude-production-increase-following-us-israel-strikes-on-iran/amp/ Accessed 3 March 2026
- “Oil prices jumping after Iran reportedly says it closed the Strait of Hormuz – CNBC” https://www.cnbc.com/2026/03/01/crude-oil-futures-iran.html Accessed 3 March 2026
- “Shutdown of Hormuz Strait raises fears of soaring oil prices – Al Jazeera” https://www.aljazeera.com/economy/2026/3/3/shutdown-of-hormuz-strait-raises-fears-of-soaring-oil-prices Accessed 3 March 2026