


The Analyst’s Read: SK Hynix Stock Now Live on Vantage – My Read at $165
 Updated Updated Thu, 2026 July 23 06:52

SK Hynix stock (NASDAQ: SKHY) is now live on Vantage, and the timing could not be twitchier. The shares closed a 15-minute bar at $165.28 as of 01:49 UTC (09:49 GMT+8) on 23 July 2026, down 0.98% for that bar, sitting below both the 50- and 200-period moving averages, six days before what might be the loudest earnings call of the summer.
The past two weeks have delivered real volatility across SK Hynix’s Seoul-listed common shares and its newly listed US ADR: a Monday collapse of roughly 15% in the Seoul-listed stock, a Tuesday rebound of 27% in the ADR, and a further 14% ADR rally the following week, all ahead of a company-specific scare that hit the tape on 22 July 2026. Let me separate what the SK Hynix stock price chart is actually doing from what the HBM4 headlines are promising.
The SK Hynix stock price chart right now
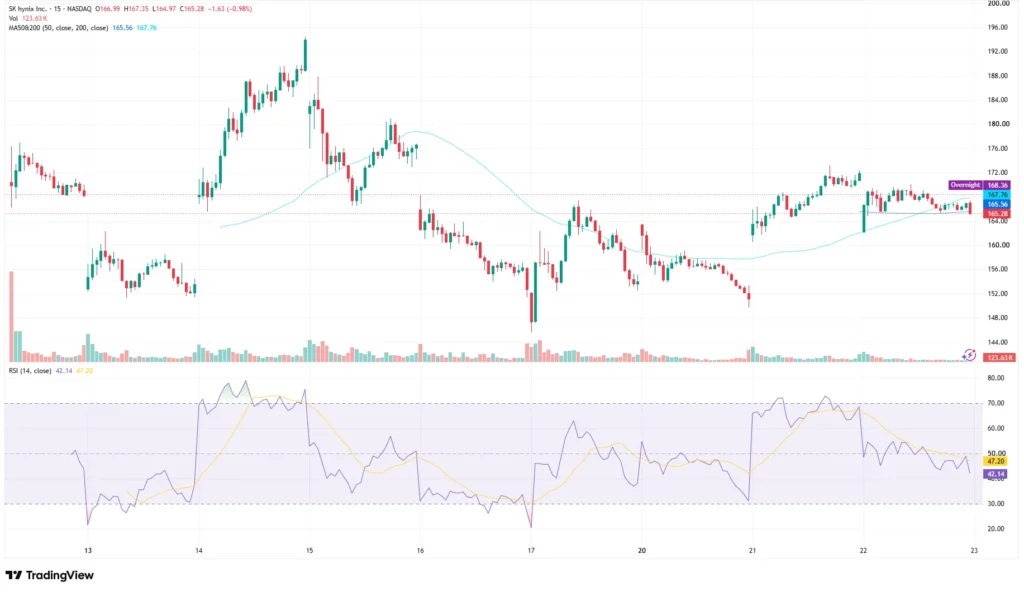
Start with what is on the screen. The 15-minute chart shows an open of $166.99, a high of $167.35, a low of $164.97, and a close of $165.28, down 0.98% for that bar, on volume of 123.63K, per the TradingView setup used for this analysis. The 50-period moving average sits at 165.56 and the 200-period at 167.76, both hovering just above the current price; the session high of $167.35 stopped just short of reclaiming the 200-period line. From a short-term technical perspective, trading below both averages leaves the immediate setup less constructive.
Zoom out across the ten sessions and the shape gets more interesting. SK Hynix stock spiked from the high 160s toward the mid-190s around 15 July, reversed hard, and dropped to the low 150s by 17 July 2026. It rebuilt from there, pushing back toward the high 160s and low 170s around 21 July, before drifting back to its current level by 23 July 2026. This is not a trend so much as a sequence of sharp re-pricings, each one keyed to a specific headline rather than a gradual re-rating.
The RSI (14, close) reads 42.14, with its moving-average overlay at 47.20, both sitting just under the neutral 50 line, per the TradingView setup used for this analysis. Neither the oversold nor the overbought threshold has been touched across the two most recent sessions. The RSI does not indicate an oversold condition; instead, it points to softer short-term momentum as price consolidates below the two moving averages. I would frame it this way: price is consolidating below a nearby cluster of overhead moving-average reference levels, ahead of the next catalyst.
The fundamental backdrop behind the SK Hynix stock price
SK Hynix listed its American depositary receipts on the Nasdaq on 10 July, pricing at $149 and opening at $170, before closing its first session at $168.01.[1] The $26.5 billion offering was the largest-ever US listing by a foreign company and, at the time, the second-largest stock sale of any kind on record, behind only SpaceX’s IPO weeks earlier; demand ran more than seven times oversubscribed.[1] Ten ADRs equal one SK Hynix common share, which matters given how the ADR premium behaved over the following days.[1]
The Seoul-listed common shares fell roughly 15% on 13 July, and the ADR fell 9.3% in the US session that same day, as the sell-off bled across the time difference.[2][3] The decline followed a Korea Investment & Securities note that cut its Q2 operating profit estimate to roughly 60.4 trillion won, about 8% below the roughly 65 trillion won consensus.[3] The firm trimmed its blended DRAM average selling price growth assumption to 28.9% quarter-on-quarter from an earlier 50%, and NH Investment & Securities analyst Ryu Young-ho flagged that HBM4 shipments, expected to build meaningfully in the second quarter, had not materialised at that scale.[3] Full-scale HBM4 production has shifted to the third quarter instead. Korea Investment & Securities did not abandon its positive investment view, but it lowered near-term earnings expectations, partly because of the timing of the HBM4 ramp.[3]
The ADR more than recovered the next day, up 27%, pushing its premium over the Seoul-listed shares to 51%.[2] Reports that SK Hynix could supply roughly 60% to 70% of Nvidia’s Vera Rubin HBM4 requirements strengthen the fundamental supply-side case, although Nvidia has not publicly disclosed exact supplier allocations.[4][5]
Nvidia has confirmed the Vera Rubin platform entered full production in June, naming SK Hynix, Samsung, and Micron as HBM4 suppliers.[4] The wider semiconductor sector had its own bruising mid-July too, with the Nasdaq Composite down 1.4% on 16 July and the sector’s benchmark ETF posting its third weekly decline in four weeks on AI-spending nerves.[6] The ADR then rallied 14% on 21 July heading into the 29 July earnings date.[7]
A fresh headline hit the next day. On 22 July, SK Hynix filed a regulatory denial of reports it was in talks to acquire Intel’s Ohio fabrication campus, and the ADR fell as much as roughly 4% before paring some of that loss.[8] That denial provided fresh company-specific context for the weakness leading into the $165.28 print used in this analysis.
Read the latest stock market news today here.
Where the chart and the fundamentals meet, and where they don’t
Here is the tension I keep coming back to. The longer-term HBM demand thesis remains intact, but near-term earnings expectations and the timing of the HBM4 ramp have become less straightforward, and the 22 July Intel denial adds a fresh company-specific wrinkle on top of that.[3][8] The chart is not confirming renewed strength either. Price sits under both moving averages, and the RSI has fallen into the low 40s rather than pushing back toward overbought as it did during the mid-July spike.
My read: the market has swung from debut euphoria, to a timing-driven earnings-estimate cut, to a 14% pre-earnings pop, to a company-specific denial, all inside two weeks, and is now sitting on its hands until 29 July arrives. Korea Investment & Securities did not abandon its positive view; it lowered near-term earnings expectations, largely on HBM4 timing.[3] That distinction matters to a stock trading on next-quarter catalysts, and the chart’s failure to reclaim its moving averages since the 21 July spike suggests traders would rather wait for the earnings date to settle the question than react to every headline in between.
Where the chart and the fundamentals genuinely agree is on volatility. Nothing here points to a quiet fortnight. A sustained move back above the 165.56-to-167.76 moving-average cluster would improve the near-term technical picture, and as of this cut-off, that move has not happened.
Levels to watch and risk framing
The table below sets out reference points from the current chart. These are levels traders are watching, not instructions.
| Reference | Value | What it means |
| Session close | $165.28 | Current price on the 15-minute bar, below both moving averages |
| 50-period MA | 165.56 | Nearest overhead reference from the chart’s own trend line |
| 200-period MA | 167.76 | Session high of 167.35 stopped just short of this level |
| Session low | $164.97 | Intraday floor on the bar under review |
Table 1: SK Hynix (NASDAQ: SKHY) levels as of 01:49 UTC (09:49 GMT+8), 23 July 2026. Source: the TradingView setup used for this analysis. Indicative only.
What to watch next: SK Hynix reports earnings on 29 July 2026, with HBM4 shipment volume and pricing commentary the two lines the market is waiting on.[7] Between now and then, a sustained move back above the 165.56-to-167.76 moving-average band would bring the near-term technical picture into better alignment with the longer-term fundamental thesis.
A stock that has already moved by double digits multiple times in two weeks carries real gap risk into a scheduled earnings date. A Stop Loss can help define an intended exit level, but it cannot eliminate gap or slippage risk; around an earnings report, execution may occur materially away from the specified level.
Leverage is a double-edged tool on a stock with this volatility profile, and it cuts both ways regardless of direction. Position sizing relative to account equity is worth revisiting ahead of 29 July, given how far SK Hynix has already moved in both directions this month. You can now trade this name directly through the Vantage SK Hynix CFD, which tracks the underlying Nasdaq-listed shares.
RISK WARNING: CFDs are complex financial instruments and carry a high risk of losing money rapidly due to leverage. You should ensure you fully understand the risks involved and carefully consider whether you can afford to take the high risk of losing your money before trading.
Disclaimer: The information is provided for educational purposes only and doesn’t take into account your personal objectives, financial circumstances, or needs. It does not constitute investment advice. We encourage you to seek independent advice if necessary. The information has not been prepared in accordance with legal requirements designed to promote the independence of investment research. No representation or warranty is given as to the accuracy or completeness of any information contained within. This material may contain historical or past performance figures and should not be relied on. Furthermore estimates, forward-looking statements, and forecasts cannot be guaranteed. The information on this site and the products and services offered are not intended for distribution to any person in any country or jurisdiction where such distribution or use would be contrary to local law or regulation.
References
[1] “SK Hynix ADR Stock (SKHYV) Rises After $26.5 Billion US Listing” – Bloomberg https://www.bloomberg.com/news/articles/2026-07-10/sk-hynix-indicated-to-climb-17-after-26-5-billion-adr-offering Accessed on 23 July 2026.
[2] “SK Hynix ADR Premium Surges Nearly 50% Over Korean Shares After US Debut” – Bloomberg https://www.bloomberg.com/news/articles/2026-07-14/sk-hynix-adr-premium-balloons-to-nearly-50-over-korean-shares Accessed on 23 July 2026.
[3] “SK Hynix Posts Worst Seoul Session on Record as HBM Contracts Limit Earnings Upside” – Tech Times https://www.techtimes.com/articles/320352/20260713/sk-hynix-posts-worst-seoul-session-record-hbm-contracts-limit-earnings-upside.htm Accessed on 23 July 2026.
[4] “Nvidia Vera Rubin Enters Full Production: Samsung, SK Hynix, Micron Named HBM4 Suppliers” – Tech Times https://www.techtimes.com/articles/317539/20260602/nvidia-vera-rubin-enters-full-production-samsung-sk-hynix-micron-named-hbm4-suppliers.htm Accessed on 23 July 2026.
[5] “SK hynix Reportedly to Supply About Two-Thirds of NVIDIA HBM4; Samsung Targets Early Delivery” – TrendForce, citing Yonhap News https://www.trendforce.com/news/2026/01/28/news-sk-hynix-reportedly-to-supply-about-two-thirds-of-nvidia-hbm4-samsung-targets-early-delivery/ Accessed on 23 July 2026.
[6] “Stock market news for July 16, 2026” – CNBC https://www.cnbc.com/2026/07/16/stock-market-today-live-updates.html Accessed on 23 July 2026.
[7] “SK Hynix Rockets 14% Ahead of July 29 Earnings as Chip Stocks Rebound” – 24/7 Wall St. https://247wallst.com/investing/2026/07/21/sk-hynix-rockets-14-ahead-of-july-29-earnings-as-chip-stocks-rebound/ Accessed on 23 July 2026.
[8] “SK Hynix Pares 4% Drop After Denying Talks to Buy Intel’s Ohio Fab as Market Shrugs Off Iran Jitters” – 24/7 Wall St. https://247wallst.com/investing/2026/07/22/sk-hynix-pares-4-drop-after-denying-talks-to-buy-intels-ohio-fab-as-market-shrugs-off-iran-jitters/ Accessed on 23 July 2026.