


[DAILY TRADING] AMD Analysis 14 July 2026 – Shares Hold Near $534 as Chip Rally Pauses Below Key Averages

Vantage Editorial Team >
Vantage Editorial Team >
Vantage is a global, multi-asset broker with a team of in-house writers and market analysts who produce educational and insightful trading content for traders of all levels.
 Updated Tue, 2026 July 14 09:56
![[DAILY TRADING] AMD Analysis 14 July 2026 – Shares Hold Near $534 as Chip Rally Pauses Below Key Averages](https://www.vantagemarketsea.com/wp-content/uploads/2026/07/ChatGPT-Image-Jul-14-2026-05_55_30-PM.webp)
As of 17:21 (GMT+8) / 09:21 UTC on 14 July 2026, the Vantage AMD CFD (Nasdaq: AMD) traded near $534.06, below both its 50-period and 200-period moving averages after a pullback from the stock’s all-time high. The move followed a broader retreat across chip stocks this week, as investors took profits following the sector’s strong AI-driven gains.[1]
This is the AMD news today driving the chart. It reads the price action and the headlines. It does not call the trade.
Key Points
- The AMD share price traded near $534 on the Vantage AMD CFD as of 17:21 (GMT+8) on 14 July 2026, below its 50-period average of $536.83 and its 200-period average of $545.96.[2]
- AMD stock remained well below the $584.73 all-time high touched on 30 June 2026, even as several Wall Street firms raised their price targets on the name this month.[3]
- AMD earnings for the second quarter land on 4 August 2026, and the Advancing AI event on 22 and 23 July 2026 is another date active traders are watching closely.[4,5]
What the chart is showing
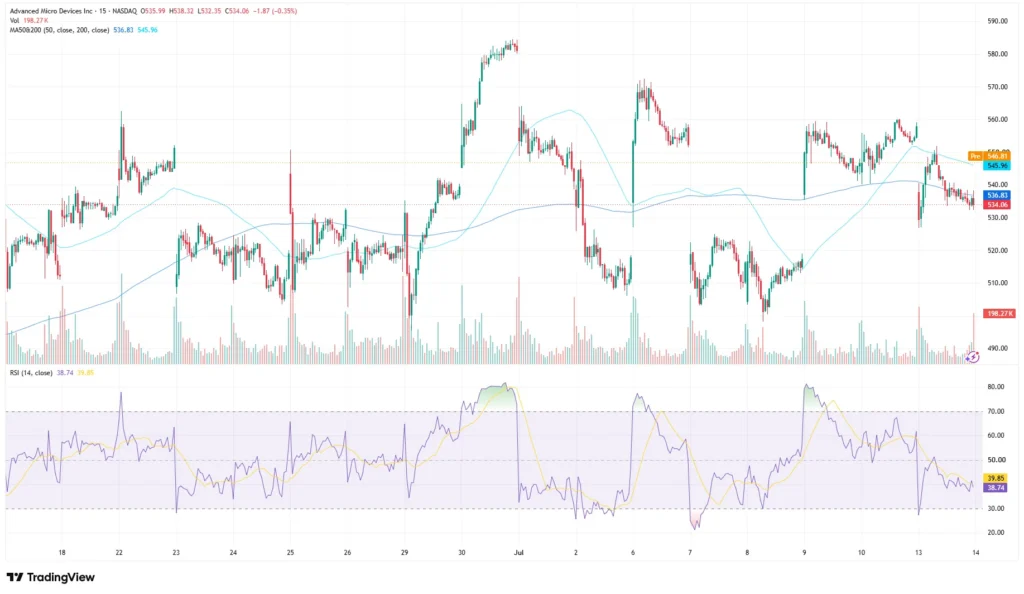
On the 15-minute chart used for this analysis, the AMD stock price today opened at $535.99, reached a high of $538.32 and a low of $532.35, before settling near $534.06, down roughly 0.35% on the candle.[2] A pre-market reading on the same setup showed $546.81, above the last traded price, showing how much ground the stock has given up over recent sessions.
Price has been trading beneath both key moving averages: the 50-period average at $536.83 and the 200-period average at $545.96, a configuration consistent with a corrective phase rather than an established uptrend.[2] The RSI on the TradingView setup used for this analysis read 38.74, with its moving-average overlay at 39.85, in the lower half of the neutral zone rather than oversold territory below 30.[2]
Zooming out, the chart shows AMD’s climb toward its all-time high of $584.73 in late June, a sharp reversal toward $490, then a partial recovery that has since faded into the current pullback.[2] Volume on the latest bar stood at 198,270 shares.[2]
Why AMD is in focus today
Chip stocks broadly retreated this week as investors weighed profit-taking against geopolitical tensions and questions about how much further 2026’s AI-driven re-rating can run.[1] AMD has been one of the biggest beneficiaries of that re-rating, and the pullback follows a period of outsized gains rather than a change in the growth narrative.
Wall Street’s view on the stock has, if anything, become more constructive even as the share price has cooled. Goldman Sachs raised its price target on AMD to $640 from $450 this month, citing agentic AI-driven CPU demand, while Citigroup upgraded the stock to Buy at $575.[3] TD Cowen also lifted its target, to $675 from $600.[4]
The latest AMD AI news centres on its data centre business. First-quarter revenue rose 38% year-on-year to $10.25 billion, with the Data Center segment up 57% to $5.80 billion, and the company has guided for approximately $11.2 billion in second-quarter revenue.[3,6] AMD earnings are due on 4 August, and the Advancing AI event on 22 and 23 July should update the MI450 and Helios AI server platform.[3,5] AMD trades as a stock CFD alongside other US shares on Vantage.
Levels traders are watching
The table below summarises the levels visible on the chart used for this analysis, alongside the broader all-time high context from wider market data.
| Level | Price | What’s happening |
| Session low | $532.35 | Low of the latest 15-minute candle on the chart used for this analysis |
| Session high | $538.32 | High of the latest 15-minute candle on the chart used for this analysis |
| 50-period average | $536.83 | Price trading just below this line |
| 200-period average | $545.96 | Price trading further below this line |
| All-time high (30 June) | $584.73 | Reference high from the broader market data |
Levels sourced from the TradingView setup used for this analysis and Barchart data cited by Yahoo Finance. Accessed on 14 July 2026.
With price under both moving averages, the area between the 50-period and 200-period lines is the zone traders are watching for any shift in that configuration. The wider distance back to the all-time high near $584.73 is a reminder of how far the 2026 rally has travelled, even after the recent pullback.

What to watch this week
- AMD earnings, 4 August: Second-quarter results land after the market close, with guidance around $11.2 billion in revenue already in place.[3]
- Advancing AI event, 22 to 23 July: Updates on the MI450 and Helios AI server platform are expected, alongside customer deployment details.[5]
- Chip-sector positioning: Broader semiconductor names remain sensitive to shifts in AI-capex sentiment heading into the wider Nasdaq earnings season.[1,7]
AMD’s move from an all-time high near $584.73 to current levels below both moving averages inside a few weeks is a reminder that position monitoring matters. A Stop Loss can help limit losses to a planned size, though it does not remove risk, and traders often review placement relative to the session highs and lows shown above.
Leverage works both ways, amplifying gains as easily as losses, particularly around scheduled catalysts such as AMD’s earnings date and its Advancing AI event. Position sizing relative to account equity is worth revisiting ahead of both dates, especially for traders holding exposure across other semiconductor CFDs.

RISK WARNING: CFDs are complex financial instruments and carry a high risk of losing money rapidly due to leverage. You should ensure you fully understand the risks involved and carefully consider whether you can afford to take the high risk of losing your money before trading.
Disclaimer: The information is provided for educational purposes only and doesn’t take into account your personal objectives, financial circumstances, or needs. It does not constitute investment advice. We encourage you to seek independent advice if necessary. The information has not been prepared in accordance with legal requirements designed to promote the independence of investment research. No representation or warranty is given as to the accuracy or completeness of any information contained within. This material may contain historical or past performance figures and should not be relied on. Furthermore estimates, forward-looking statements, and forecasts cannot be guaranteed. The information on this site and the products and services offered are not intended for distribution to any person in any country or jurisdiction where such distribution or use would be contrary to local law or regulation.
References
[1] “Advanced Micro Devices, Inc. (AMD) Stock Price, News, Quote & History – Yahoo Finance” https://finance.yahoo.com/quote/AMD/ Accessed on 14 July 2026.
[2] “AMD Stock Price and Chart – TradingView” https://www.tradingview.com/symbols/NASDAQ-AMD/ Accessed on 14 July 2026.
[3] “AMD Stock Is Up 160% in 2026 and Analysts Still Love It – Yahoo Finance” https://finance.yahoo.com/markets/stocks/articles/amd-stock-160-2026-analysts-141502071.html Accessed on 14 July 2026.
[4] “AMD: Advanced Micro Devices Inc – Stock Price, Quote and News – CNN” https://www.cnn.com/markets/stocks/AMD Accessed on 14 July 2026.
[5] “Why July Could Be a Big Month for AMD Stock Investors – The Motley Fool” https://www.fool.com/investing/2026/07/04/why-july-could-be-a-big-month-for-amd-stock-invest/ Accessed on 14 July 2026.
[6] “1 Prediction for AMD Stock Over the Next 5 Years – 24/7 Wall St.” https://247wallst.com/investing/2026/07/07/1-prediction-for-amd-stock-over-the-next-5-years/ Accessed on 14 July 2026.
[7] “AMD: Advanced Micro Devices Inc – Stock Price, Quote and News – CNBC” https://www.cnbc.com/quotes/AMD Accessed on 14 July 2026.