Crude Oil Prices Today: WTI $81, Brent $84 After Nearly 30% Retreat
Vantage Editorial Team >
Vantage Editorial Team >
Vantage is a global, multi-asset broker with a team of in-house writers and market analysts who produce educational and insightful trading content for traders of all levels.
Crude oil prices today are nearly 30% below their 2026 highs. WTI crude (USOUSD) was near $81.16 and Brent crude (UKOUSD) near $84.24 as of 01:33 UTC on 16 June 2026 (09:33 GMT+8), per the Vantage USOUSD and UKOUSD CFD feeds. Both benchmarks have unwound nearly all the war-driven premiums that lifted prices to multi-year highs in late April.
The unwind appears to be driven primarily by easing geopolitical risk premium rather than evidence of a sharp deterioration in physical demand. Physical inventories remain historically tight, and shipping flows through the Strait of Hormuz remain below pre-conflict levels, according to market reports.
The lower move in oil prices today has been driven by ceasefire optimism, markets pricing in the possibility of supply normalisation before it has arrived in the data. Oil markets typically price expected supply conditions months ahead of physical inventory data, which helps explain why prices have fallen faster than actual supply has recovered.
All prices are from the Vantage CFD feeds as of 01:33 UTC, 16 June 2026. Charts are from the TradingView setup used for this analysis. This is not financial advice.
Key points
- Crude oil prices today: WTI (USOUSD) near $81.16, Brent (UKOUSD) near $84.24 as of 01:33 UTC on 16 June 2026 — both down roughly 30% from their April peaks.
- Both daily charts show price trading between the daily 50-period MA (WTI: $74.06 / Brent: $78.98) and the daily 200-period MA (WTI: $96.39 / Brent: $101.95), with both RSI readings nearing the traditional oversold threshold of 30.
- Three forces are converging: ceasefire optimism reducing the geopolitical risk premium, OPEC+ output increases that some analysts described as largely symbolic while Gulf exports remain disrupted, and US crude inventories approximately 4% below their five-year average.[1]
What the oil price chart shows
WTI crude oil (USOUSD)
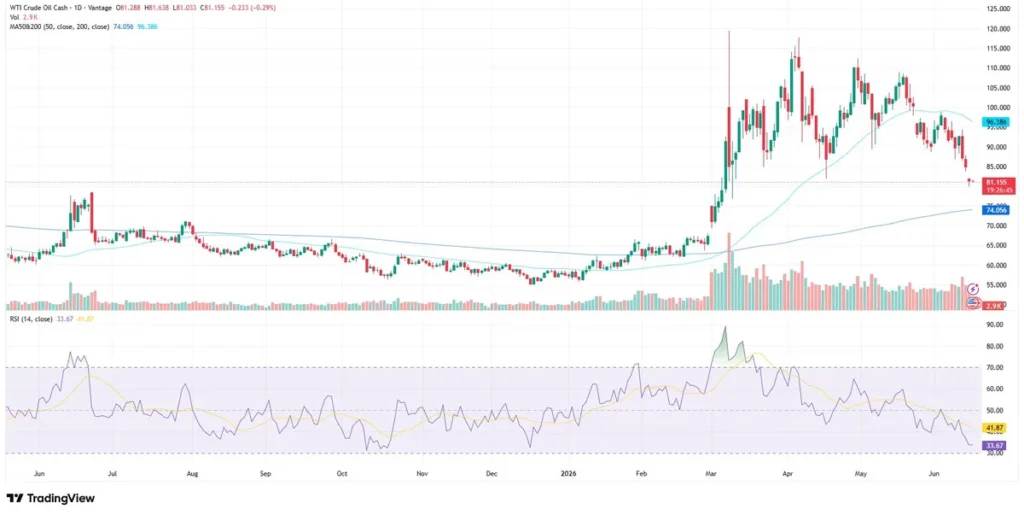
The USOUSD daily chart runs from June 2025 to present. WTI range-traded near $60-$65 through late January 2026 as OPEC+ unwound voluntary cuts into an oversupplied market. The Middle East conflict that began on 28 February 2026 triggered a near-vertical rally, carrying WTI to above $115 in late April.
Since that peak, prices have been in a sustained decline since late April. WTI’s daily 50-period MA at $74.06 sits below the current price; the daily 200-period MA at $96.39 may act as a potential resistance zone, near the area where much of the conflict-driven rally has since unwound. The RSI (14) from the TradingView setup used for this analysis reads 33.67, with the RSI MA at 41.87. The gap between the two lines has been widening since early June.
Brent crude oil (UKOUSD)
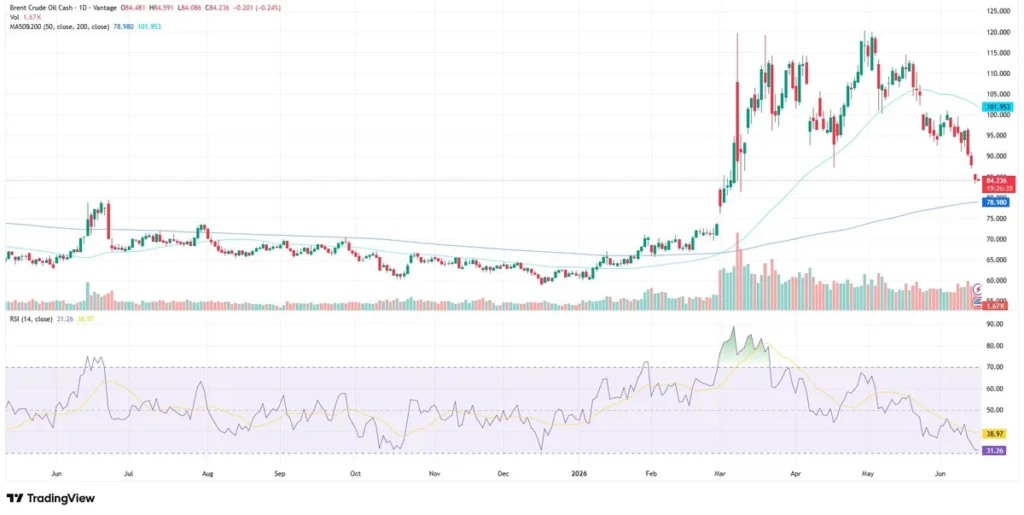
The UKOUSD chart follows the same arc. Brent crude opened 2026 near $62 before the geopolitical risk premium lifted it to above $119 at the April peak. By 16 June 2026, the Brent crude oil price had fallen to $84.24, a drawdown of approximately 29% from that peak.
Brent’s daily 50-period MA at $78.98 is the nearest dynamic reference below, with the daily 200-period MA at $101.95 sitting near the region occupied during the height of the conflict-driven rally. The RSI (14) on UKOUSD reads 31.26, RSI MA at 38.97 — Brent is fractionally closer to oversold territory than WTI, consistent with its larger percentage decline from the peak.
Three forces driving oil news today
Ceasefire progress
A key driver of crude oil prices since May has been the state of US-Iran talks. The Middle East conflict that began 28 February 2026 threatened a trade route that typically carries around one-fifth of global petroleum consumption, restricting most tanker traffic through the Strait of Hormuz.[1] By late May, the Brent spot average fell to around $107/barrel, its sharpest monthly decline since the Covid-19 pandemic, after reports that both sides had “mostly agreed” on a 60-day ceasefire extension.[2]
As of 15 June 2026, Fortune reported Brent near $84.62, noting a peace deal appeared to be holding.[3] However, UBS analysts cautioned that Iran crude loadings in May remained below 0.3 million barrels per day, versus 1.5 million barrels per day in April — physical supply has not yet caught up to the price move.[2]
OPEC+ output decisions
On 3 May 2026, seven OPEC+ members agreed to raise output by 188,000 barrels per day for June, following a similar 206,000 bpd increase in May.[4] Saudi Arabia’s actual March production was 7.76 million bpd against a paper quota of 10.29 million bpd, Al Jazeera reported analysts described the June increase as “largely symbolic” given ongoing Gulf export disruptions.[5] The group’s statement preserved flexibility to reverse the increase if market conditions deteriorate.
US inventories and production
The EIA’s Weekly Petroleum Status Report for the week ending 5 June 2026 included a re-benchmarking that raised the domestic production estimate by 88,000 barrels per day.[6] Commercial crude inventories (excluding the Strategic Petroleum Reserve) stood approximately 4% below the five-year average for this time of year.[1] The EIA’s May Short-Term Energy Outlook assessed that Gulf producers collectively shut in around 10.5 million barrels per day in April, inventory draws that have kept a floor under prices even as demand softened.[7]
Learn everything you need to know about oil trading here.
Key levels to watch on USOUSD and UKOUSD
The table below covers support and resistance zones from the daily charts as of 01:33 UTC on 16 June 2026. These are chart reference levels, not trade signals.
| Instrument | Support | Resistance | Context |
| USOUSD (WTI) | $78.00 / $75.00 | $85.00 / $90.00 | RSI 33.67; Daily 200-period MA $96.39 |
| UKOUSD (Brent) | $82.00 / $78.98 | $88.00 / $92.50 | RSI 31.26; Daily 200-period MA $101.95 |
TradingView levels as of 01:33 UTC, 16 June 2026. Sources: Data indicative, for informational purposes only.
On WTI, the $78.00 zone aligns with pre-conflict consolidation from early 2026; the daily 50-period MA at $74.06 sits close below. On Brent, $82.00 is the nearest visible floor, with the daily 50-period MA at $78.98 around $5 lower. Both RSI readings are nearing the traditional oversold threshold of 30, a level traders often monitor alongside volume for signs of slowing momentum.
What to watch this week
- EIA weekly inventory report, 17 June 2026: Covers data through 13 June. A larger-than-expected draw could slow the decline; a surprise build would add further pressure to both benchmarks.
- Strait of Hormuz shipping data, Ongoing: Physical tanker loadings are the leading indicator of whether the ceasefire is translating into actual supply recovery. Iran crude loadings were still near 0.3 million bpd in May versus 1.5 million bpd in April.
- US-Iran ceasefire updates, Ongoing: Any formal signing of a memorandum of understanding, or a breakdown in talks, would trigger a rapid re-pricing across both WTI and Brent.
Managing exposure around volatile crude oil prices
Market participants often monitor Stop Loss levels with reference to nearby chart structures. For WTI, the $78.00 zone and the daily 50-period MA at $74.06 are the nearest references below current price; for Brent, $82.00 and the daily 50-period MA at $78.98. Both benchmarks have been reacting to geopolitical headlines within minutes, compressing the window between a price move and a fill. Traders holding positions across both grades should factor in the correlation: when ceasefire news breaks, WTI and Brent typically move together.
Leverage amplifies both potential returns and potential losses in equal measure. Crude oil CFDs can gap at market open when major oil news breaks outside trading hours. Reviewing position sizing relative to account equity is particularly relevant ahead of the EIA report on 17 June, with both WTI and Brent sitting near technically sensitive levels.

RISK WARNING: CFDs are complex financial instruments and carry a high risk of losing money rapidly due to leverage. You should ensure you fully understand the risks involved and carefully consider whether you can afford to take the high risk of losing your money before trading.
Disclaimer: The information is provided for educational purposes only and doesn’t take into account your personal objectives, financial circumstances, or needs. It does not constitute investment advice. We encourage you to seek independent advice if necessary. The information has not been prepared in accordance with legal requirements designed to promote the independence of investment research. No representation or warranty is given as to the accuracy or completeness of any information contained within. This material may contain historical or past performance figures and should not be relied on. Furthermore estimates, forward-looking statements, and forecasts cannot be guaranteed. The information on this site and the products and services offered are not intended for distribution to any person in any country or jurisdiction where such distribution or use would be contrary to local law or regulation.
References
[1] “Short-Term Energy Outlook: Global oil markets – US Energy Information Administration” https://www.eia.gov/outlooks/steo/report/global_oil.php Accessed on 16 June 2026.
[2] “Oil drops 20% from 2026 peak on optimism over US-Iran ceasefire talks – CNBC” https://www.cnbc.com/2026/05/29/oil-prices-iran-ceasefire-us-trump-strait-hormuz-energy-costs.html Accessed on 16 June 2026.
[3] “Current price of oil as of June 15, 2026 – Fortune” https://fortune.com/article/price-of-oil-06-15-2026/ Accessed on 16 June 2026.
[4] “OPEC+ Members Adjust Output, Reaffirm Market Stability Commitment – Egypt Oil and Gas” https://egyptoil-gas.com/news/opec-members-adjust-output-reaffirm-market-stability-commitment/ Accessed on 16 June 2026.
[5] “OPEC+ announces symbolic oil output rise during Strait of Hormuz closure – Al Jazeera” https://www.aljazeera.com/news/2026/5/3/opec-announces-symbolic-oil-output-rise-during-strait-of-hormuz-closure Accessed on 16 June 2026.
[6] “Weekly Petroleum Status Report (week ending 5 June 2026) – US Energy Information Administration” https://www.eia.gov/petroleum/supply/weekly/ Accessed on 16 June 2026.
[7] “May 2026 Short-Term Energy Outlook – US Energy Information Administration” https://www.eia.gov/outlooks/steo/pdf/steo_text.pdf Accessed on 16 June 2026.
[8] “OPEC Monthly Oil Market Report, June 2026 – OPEC” https://publications.opec.org/momr Accessed on 16 June 2026.
