[DAILY TRADING] META Analysis 3 July 2026 – Meta Stock Price Pulls Back After AI Cloud Rally
Vantage Editorial Team >
Vantage Editorial Team >
Vantage is a global, multi-asset broker with a team of in-house writers and market analysts who produce educational and insightful trading content for traders of all levels.
![[DAILY TRADING] META Analysis 3 July 2026 – Meta Stock Price Pulls Back After AI Cloud Rally](https://www.vantagemarketsea.com/wp-content/uploads/2026/07/ChatGPT-Image-Jul-3-2026-05_47_44-PM.webp)
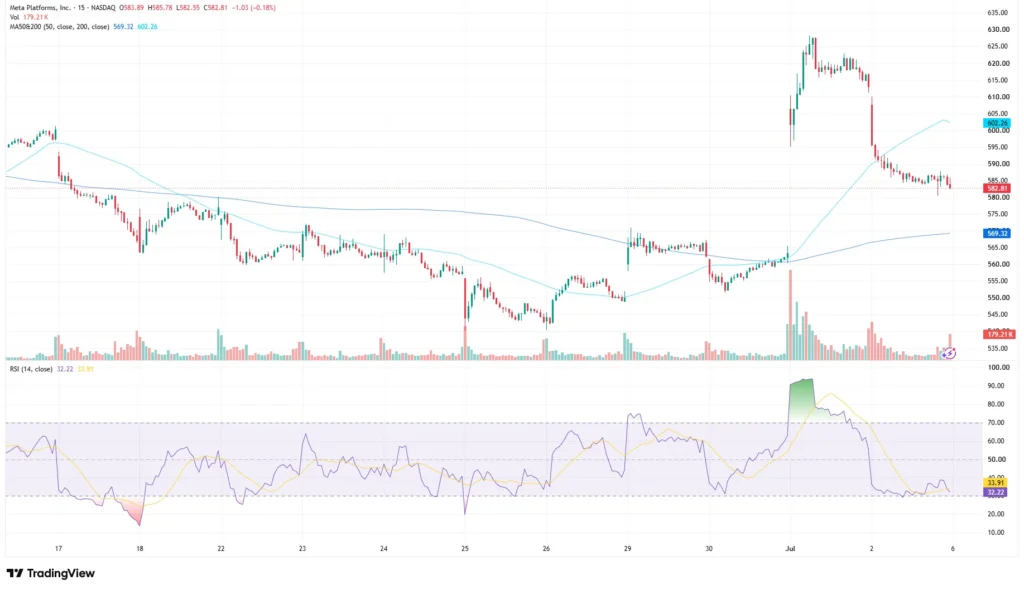
As of 17:30 (GMT+8) / 09:30 UTC on 3 July 2026, Meta stock price on Meta Platforms, Inc. (NASDAQ: META) traded near $582.81 on the Vantage META CFD, down 0.18% on the session. The Meta share price today moved between $582.55 and $585.78 on the 15-minute chart used for this analysis, a narrow range next to the drama of the past fortnight. META added more than 10% on 1 July 2026 on reports of a new AI cloud business, then gave back a chunk of that move once analysts flagged a heavier capital spending bill. This piece reads the chart and the news behind it, without calling the next move.
Key Points
- Meta stock price traded near $582.81 on 3 July 2026, easing back from the $630 area reached during 1 July’s AI cloud-business rally on the Vantage META CFD.
- The rally followed reports that Meta is developing a “Meta Compute” cloud arm to sell spare AI capacity, a move Wolfe Research says could push 2027 capital spending toward $200 billion.1,2
- The Relative Strength Index reads 32.22 on the TradingView setup used for this analysis, with the Meta share price still holding above the 50-period moving average near $569.30.
What the chart is showing
At the cut-off above, Meta stock price held inside a narrow $3.23 range for the session, a calmer picture than the swings of the past fortnight.
The bigger picture is the round trip the Meta share price has made since mid-June: from the low $600s toward $540 by 25 June 2026, back to the high $550s by 29 June, then sharply into the $600 to $630 range around 1 July before retreating through 2 July. The 50-period moving average sits near $569.30, well below current price. The 200-period moving average remains near $602.26, highlighting that the recent pullback has left price below the longer-term trend on this intraday timeframe.
The Relative Strength Index (14, close) reads 32.22, with its moving-average overlay at 33.91, attributed to the TradingView setup used for this analysis. Both readings sit near the lower end of the neutral range and are approaching the conventional oversold threshold, in keeping with the pullback from the 1 July peak. Volume for the session stands at 179.21K per the Vantage CFD feed, well down from the surge seen around the 1 and 2 July sessions.
The story behind the move
The rally that took Meta stock price toward $630 traced back to a Bloomberg report on 1 July that Meta Platforms is building a cloud business, internally referred to as “Meta Compute,” to sell spare artificial intelligence computing capacity to other companies.1,2
The report described spare compute capacity offered to other companies, alongside hosted access to Meta’s own AI models.2 Chief Executive Mark Zuckerberg told shareholders a cloud business was “definitely on the table,” adding weight to the report.1
Wolfe Research analysts estimated the extra capacity could add meaningfully to earnings per share, and META added more than 10% intraday on 1 July, coinciding with falls in rival infrastructure names CoreWeave and Nebius Group on competitive concerns.2,3
The tone shifted on 2 July 2026. The same Wolfe Research note flagged that funding a cloud build-out could push Meta’s 2027 capital expenditure toward $200 billion, up from prior estimates near $160 billion, and suggested the company may need to raise capital to support it.3 Meta share price fell as much as 4% intraday on 2 July 2026 before closing at $584.88, and the pullback has carried through into the 3 July session.3,4
Levels traders are watching
The table below sets out the zones visible on the chart as of the 3 July session. These are reference levels drawn from price action and moving averages, not trade signals.
| Level | Price | What It Reflects |
| Support | 580.00 – 582.55 | The 3 July intraday low zone, close to 2 July’s session low of 580.42 |
| Support | 569.30 | The 50-period moving average on the chart used for this analysis |
| Resistance | 590.00 – 592.00 | The ceiling formed as price retreated through the 2 July session |
| Resistance | 602.26 | The 200-period moving average on the chart used for this analysis |
| Resistance | 611.00 – 630.00 | The range that capped the 1 July rally on the AI cloud compute report |
Table 1: Key levels as of 3 July 2026, drawn from the Vantage META CFD chart and the TradingView setup used for this analysis.
What to watch next
- Wolfe Research and Peer Commentary: Further analyst notes on Meta’s capital expenditure plans and any potential capital raise are likely to keep moving sentiment around the stock.3
- Cloud Business Detail: Any additional disclosure from Meta on how the reported Meta Compute arm might be structured or monetised remains a live catalyst.2
- Next Earnings, 29 July 2026: Meta’s next scheduled results will give the clearest read yet on how the AI capex bill and any new cloud revenue plans are shaping guidance.5
- Broader AI-Infrastructure Sentiment: Moves in CoreWeave, Nebius, and other cloud names have tracked the Meta Compute headlines and are worth watching alongside META share CFDs.2
Given the size of the recent swings in Meta stock price, from the high $500s to $630 and back within a couple of weeks, market participants often keep a closer eye on Stop Loss placement around the levels set out above, since intraday range assumptions have been less reliable while the capex and cloud-business headlines develop.
Leverage works both ways in this headline-driven environment: it can magnify gains as easily as losses, and it is worth revisiting position sizing relative to account equity, particularly given META’s history of double-digit single-day moves this year.
RISK WARNING: CFDs are complex financial instruments and carry a high risk of losing money rapidly due to leverage. You should ensure you fully understand the risks involved and carefully consider whether you can afford to take the high risk of losing your money before trading.
Disclaimer: The information is provided for educational purposes only and doesn’t take into account your personal objectives, financial circumstances, or needs. It does not constitute investment advice. We encourage you to seek independent advice if necessary. The information has not been prepared in accordance with legal requirements designed to promote the independence of investment research. No representation or warranty is given as to the accuracy or completeness of any information contained within. This material may contain historical or past performance figures and should not be relied on. Furthermore estimates, forward-looking statements, and forecasts cannot be guaranteed. The information on this site and the products and services offered are not intended for distribution to any person in any country or jurisdiction where such distribution or use would be contrary to local law or regulation.
References
[1] “Meta jumps on report it is building cloud business for excess AI compute – Seeking Alpha” https://seekingalpha.com/news/4608948-meta-jumps-on-report-it-is-building-cloud-business-for-excess-ai-compute Accessed on 3 July 2026.
[2] “Meta shares jump 9% on reported plan to offer AI infrastructure services – SiliconANGLE” https://siliconangle.com/2026/07/01/meta-shares-jump-9-reported-plan-offer-ai-infrastructure-services/ Accessed on 3 July 2026.
[3] “Why Meta Platforms Stock Crashed Thursday Morning – The Motley Fool” https://www.fool.com/investing/2026/07/02/why-meta-platforms-stock-crashed-thursday-morning/ Accessed on 3 July 2026.
[4] “Meta Platforms Inc (META) Stock Price & News – Google Finance” https://www.google.com/finance/beta/quote/META:NASDAQ Accessed on 3 July 2026.
[5] “META Stock Price – Meta Platforms Chart – TradingView” https://www.tradingview.com/symbols/NASDAQ-META/ Accessed on 3 July 2026.
