


[DAILY TRADING] XAGUSD Analysis 16 July 2026 – Silver Price Today Sinks to $56.90 as Middle East Risk Builds

Vantage Editorial Team >
Vantage Editorial Team >
Vantage is a global, multi-asset broker with a team of in-house writers and market analysts who produce educational and insightful trading content for traders of all levels.
 Updated Thu, 2026 July 16 09:27
![[DAILY TRADING] XAGUSD Analysis 16 July 2026 – Silver Price Today Sinks to $56.90 as Middle East Risk Builds](https://www.vantagemarketsea.com/wp-content/uploads/2026/06/XAGUSD_banner_900x430_optimized.webp)
Silver price today sits near $56.90 on the Vantage XAGUSD CFD as of 16:37 (GMT+8) / 08:37 UTC on 16 July 2026, consolidating in a narrow range after a week of sustained declines. The metal has slipped from levels above $61.00 earlier in the week as renewed escalation between the United States and Iran lifted oil prices and reinforced market expectations that the Federal Reserve may need to keep policy restrictive.
This piece reads the chart and the macro backdrop as they stand at the cut-off above. It does not call the next move.
Silver price chart today: what XAGUSD is showing
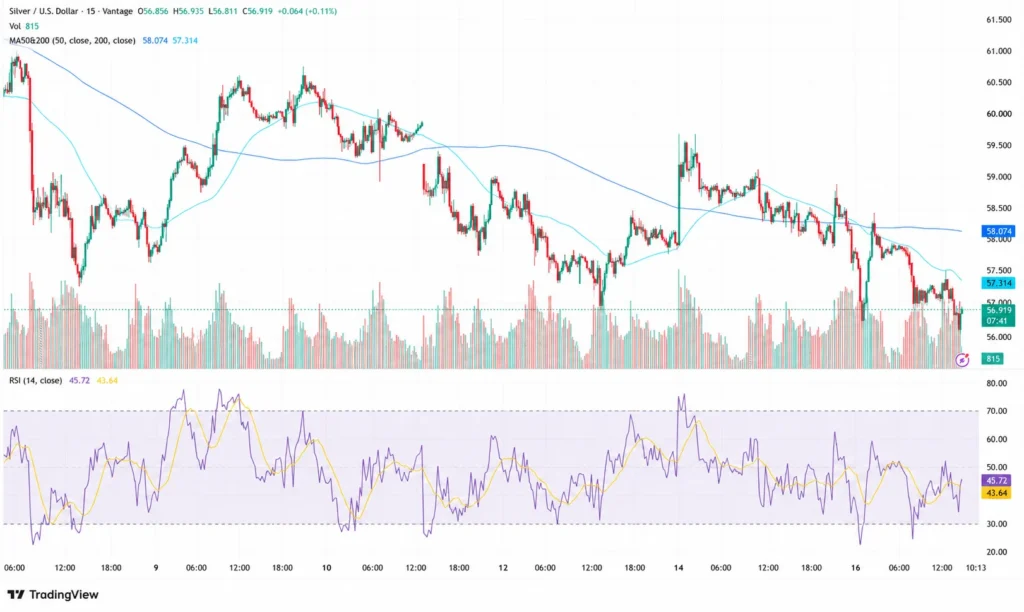
On the 15-minute Vantage XAGUSD CFD chart, the session opened at $56.856, reached a high of $56.935 and a low of $56.811, before last trading near $56.919, up $0.064, or 0.11%, at the cut-off.[1] Session volume stood at 816 contracts on the chart used for this analysis.[1]
Traders searching for the silver price now, the current silver price, or the price of silver today are looking at the same benchmark this piece tracks: the XAG/USD spot rate the Vantage XAGUSD CFD is built on. Some also search under silver stock price or silver rate today, though silver is a commodity, not a stock. Broader spot-market quotes sat nearby this week, with Forbes Advisor and USAGold both citing prices in the high $58 range on 15 July 2026 before the latest leg lower.[5][6] CFD pricing on the Vantage feed can differ slightly from spot due to feed timing and spreads.
Zooming out, the silver price chart shows the metal stepping down from a level above $61.00 in the 8 July session, briefly rebounding toward $59.80 around 12 and 13 July, then resuming the decline into this week.[1] The 50-period moving average sits at $58.074 and the 200-period moving average at $57.314, both positioned above the last traded price and acting as overhead references rather than support, on the TradingView setup used for this analysis.[1]
The 14-period RSI reads 45.72, with its moving-average overlay at 43.64, on the TradingView setup used for this analysis.[1] Both sit below the neutral 50 mark but remain well clear of the 30 threshold usually associated with oversold conditions, suggesting selling momentum has moderated without signalling a confirmed reversal.
Silver news today: Middle East escalation keeps the pressure on
The renewed weakness followed a collapsed truce. The United States carried out fresh strikes on Iranian coastal defences and missile sites after reinstating a naval blockade on Iranian ports, and Iran struck back at US-linked military sites in the region, according to CNBC.[2] Oil prices have extended gains across several sessions alongside the escalation, keeping energy-driven inflation risk in view across the precious metals complex.[2]
June’s US inflation readings had actually slowed, with CNBC reporting that headline consumer and producer prices eased on lower energy costs before the latest round of strikes.[2] That moderation predates the fresh escalation, and markets are treating it as backward-looking rather than as a signal that price pressures are fully contained.[2]
Silver price forecast 2026: the rate path traders are watching
At the time of writing, CME FedWatch data cited by CNBC on 16 July 2026 indicated roughly a 73% probability of a Fed rate hike by the December meeting.[2] That reflects a market that has priced out rate cuts for now, with the Iran-linked oil rally reinforcing the hawkish lean. Fed Chair Kevin Warsh used recent congressional testimony to reiterate the central bank’s commitment to restoring price stability, without signalling a more hawkish shift in policy language.[3]
Higher rate-hike odds tend to weigh on non-yielding metals such as silver, since they raise the opportunity cost of holding assets that pay no interest and tend to support the US dollar. On the silver price forecast 2026 question, J.P. Morgan Global Research has projected silver could average around $81 per ounce across the year given industrial demand and a persistent supply deficit, a figure well above current levels and a reminder that bank forecasts vary widely.[4]
Current silver price levels to watch and risk considerations
The table below covers reference zones on the Vantage XAGUSD CFD chart as of the cut-off above. These are levels traders are watching, not trade signals.
| Level | Price | What’s happening |
| Session low | $56.811 | Today’s intraday low on the 15-min chart |
| Session high | $56.935 | Today’s intraday high on the 15-min chart |
| 200-period MA | $57.314 | Nearest moving-average reference above current price |
| 50-period MA | $58.074 | Secondary moving-average reference further above price |
| Prior swing high (8 July) | ~$61.00 | Level silver has stepped down from this week |
Table 1: Vantage XAGUSD CFD levels as of 16:37 (GMT+8) / 08:37 UTC, 16 July 2026. Source: TradingView. Indicative only, not trade signals.

What to watch:
- FOMC Meeting, 28–29 July 2026: the next scheduled Federal Reserve rate decision, which will show how the committee is weighing the latest inflation and Middle East-driven energy risk.
- Middle East developments, ongoing: any further escalation or a fresh de-escalation attempt between the US and Iran could shift oil-driven inflation expectations and, with them, precious metals positioning.
- US data calendar, this week: further US data releases this week may add to the picture building since June’s CPI and PPI prints.
On risk management, the session’s narrow intraday range on the 15-minute chart sits well inside the week’s broader decline from above $61.00. Market participants often monitor a Stop Loss placed relative to the levels above, alongside the session low and high, as reference points given how quickly Middle East headlines have moved silver, gold, and oil this month. If you hold XAUUSD, USDJPY, or oil-linked CFDs alongside XAGUSD, checking combined USD and commodity exposure is worth doing ahead of further geopolitical developments.
Leverage works both ways in a session like this: it can just as easily magnify a loss as a gain, particularly around fast-moving geopolitical headlines. Position sizing relative to account equity is worth revisiting given the current pace of the Middle East conflict and the run-up to the 28–29 July FOMC meeting.

RISK WARNING: CFDs are complex financial instruments and carry a high risk of losing money rapidly due to leverage. You should ensure you fully understand the risks involved and carefully consider whether you can afford to take the high risk of losing your money before trading.
Disclaimer: The information is provided for educational purposes only and doesn’t take into account your personal objectives, financial circumstances, or needs. It does not constitute investment advice. We encourage you to seek independent advice if necessary. The information has not been prepared in accordance with legal requirements designed to promote the independence of investment research. No representation or warranty is given as to the accuracy or completeness of any information contained within. This material may contain historical or past performance figures and should not be relied on. Furthermore estimates, forward-looking statements, and forecasts cannot be guaranteed. The information on this site and the products and services offered are not intended for distribution to any person in any country or jurisdiction where such distribution or use would be contrary to local law or regulation.
References
[1] “XAGUSD 15-Minute Chart, Vantage CFD – TradingView” https://www.tradingview.com/symbols/XAGUSD/ Accessed on 16 July 2026.
[2] “Gold falls as Mideast escalation dims hopes of easing inflation – CNBC” https://www.cnbc.com/2026/07/16/gold-falls-as-mideast-escalation-dims-hopes-of-easing-inflation.html Accessed on 16 July 2026.
[3] “Gold slides over 1% as oil surges on Strait of Hormuz closure fears – CNBC” https://www.cnbc.com/2026/07/13/gold-slides-over-1percent-as-oil-surges-on-strait-of-hormuz-closure-fears.html Accessed on 16 July 2026.
[4] “How Will Silver Prices Fare in 2026? – J.P. Morgan Global Research” https://www.jpmorgan.com/insights/global-research/commodities/silver-prices Accessed on 16 July 2026.
[5] “Silver Price Today – Forbes Advisor” https://www.forbes.com/advisor/investing/silver-price/ Accessed on 16 July 2026.
[6] “Silver Price History: Interactive Charts and Data – USAGold” https://www.usagold.com/daily-silver-price-history/ Accessed on 16 July 2026.