[DAILY TRADING] SP500 22 May 2026 — S&P 500 at 7,474 as Session High of 7,484 Fades on Nvidia Guidance Softness and Walmart Decline
Vantage Editorial Team >
Vantage Editorial Team >
Vantage is a global, multi-asset broker with a team of in-house writers and market analysts who produce educational and insightful trading content for traders of all levels.
![[DAILY TRADING] SP500 22 May 2026 — S&P 500 at 7,474 as Session High of 7,484 Fades on Nvidia Guidance Softness and Walmart Decline](https://www.vantagemarketsea.com/wp-content/uploads/2026/05/SP500_Hero_Image.webp)
The Vantage S&P 500 Index Cash CFD (SP500) stands at 7,474.16 as of 07:16 UTC on 22 May 2026, having pulled back approximately 10 points from a session high near 7,484. The SP500 chart shows a 15-point intraday range before a sharp fade on elevated volume around 06:00 UTC. Nvidia’s guidance for the upcoming quarter fell short of the upper range of analyst expectations, according to Trading Economics,[1] and Walmart fell approximately 6% on weaker forward guidance, as per CNBC,[2] with both developments continuing to shape SP500 news today.
All prices refer to the Vantage S&P Index Cash CFD as of 07:16 UTC on 22 May 2026. Charts from TradingView via Vantage are indicative and may differ from underlying index prices. This is not financial advice.
Key Points
- The SP500 chart recorded a session low near 7,468.15 in the early overnight session and a session high near 7,484 around 06:40 UTC on 22 May 2026, before the SP500 price pulled back to 7,474.16 as of 07:16 UTC on elevated volume around the 06:00 UTC European open.
- Nvidia reported fiscal Q1 FY2027 revenue rising approximately 85% year-on-year to a record level and beat Wall Street’s consensus estimate, per FXEmpire,[3] raising its quarterly dividend to 25 cents per share. The guidance for the upcoming quarter, however, fell short of the upper range of analyst expectations, per Trading Economics.[1]
- Walmart fell approximately 6.43% on 21 May after reporting weaker-than-expected forward guidance, as stated by Trading Economics.[1] The 10-year US Treasury yield finished 21 May at approximately 4.564%, per CNBC, after a one-day reprieve tied to Iran talks optimism.[2]
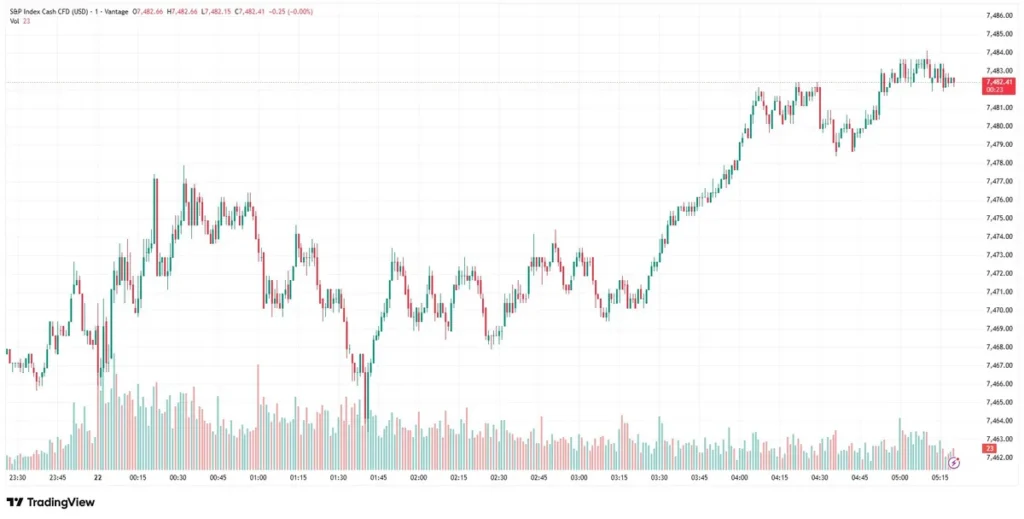
SP500 TradingView Chart: Session High 7,484 Before 10-Point Late-Session Fade
The 1-minute Vantage S&P Index Cash CFD chart covers 01:30 to 07:16 UTC on 22 May 2026. From approximately 7,467 at the visible session start, the index dipped to a local low near 7,468 around 02:26 UTC before recovering choppily to 7,471.66 by 03:15 UTC. A decisive advance then pushed the SP500 price to a session high near 7,481 around 04:15 UTC. After consolidating between 7,478 and 7,484 through 05:30 UTC, a sharp decline on elevated volume around 07:00 UTC pulled the index to 7,471, with volatile trade between 7,471 and 7,484 through 07:00 UTC. The current level stands at 7,474.16 as of 07:16 UTC, showing +0.13 (+0.00%) on the current candle.
SP500 News Today: What Is Moving the Index
Nvidia and Walmart: Two Earnings Stories in One Session
Nvidia’s Q1 FY2027 revenue jumped approximately 85% year-on-year to a record level, beating Wall Street’s consensus estimate, FXEmpire stated,[3] while the company raised its dividend to 25 cents per share. The next-quarter guidance fell short of the upper range of investor expectations, as noted by Trading Economics, and the semiconductor sector pulled back.[1] Walmart fell approximately 6.43% on weaker forward guidance, weighing on the broader index even as health care and utilities held positive, as reported by CNBC.[2]
Treasury Yields and Oil: the Macro Backdrop
The 10-year yield finished 21 May at approximately 4.564% after a one-day reprieve on Iran talks optimism, CNBC stated further.[2] WTI crude rebounded on 21 May after comments from Iran’s supreme leader on uranium enrichment policy, keeping energy prices elevated.[5]
SP500 Technical Analysis: Key Levels as of 07:16 UTC, 22 May 2026
Reference levels on the Vantage S&P Index Cash CFD. Not trade signals.
| Instrument | Support | Resistance | What’s Happening |
| Vantage SP500 CFD | 7,462 / 7,445 | 7,484 / 7,500 | At 7,474.16 as of 07:16 UTC; 15-point session range; pulled back from session high 7,484 on elevated volume around 06:00 UTC |
Table 1: Vantage S&P Index Cash CFD levels as of 07:16 UTC, 22 May 2026. Sources: TradingView, CNBC, Trading Economics, Investing.com. Indicative only. Current SP500 price reference levels sourced from Investing.com.[6]
SP500 Forecast: What to Watch Today
- Flash PMI, 09:45 ET (13:45 UTC): Stocktwits cited that this is the key macro data point today alongside jobless claims. A soft manufacturing reading would compound concerns from the Nvidia guidance softness.[4]
- US-Iran Negotiations, Ongoing: Trump described negotiations as advancing, though comments from Iran’s supreme leader on uranium enrichment policy introduced fresh uncertainty on 21 May. Any credible progress signal would ease oil prices and support the SP500 today.[5]
- US Initial Jobless Claims, 08:30 ET (12:30 UTC): A reading near the 209,000 level reported last week, according to FXEmpire, would signal a resilient labour market. A higher print would weigh on SP500 sentiment ahead of the open.[7]
- University of Michigan Consumer Sentiment and Fed tone, 22 May: Elevated inflation expectations would reinforce higher-for-longer rate bets. Charles Schwab flagged this as a key sentiment anchor for the week alongside Fed minutes.[9]
Many traders may watch the 7,462 local low and 7,484 session high as reference zones on the SP500 chart, per Investing.com.[6] If you hold gold (XAUUSD), AUDUSD, or Nikkei 225 alongside the SP500 today, check combined exposure before the data releases. Position sizing and leverage management matter on a day when earnings, macro, and geopolitical catalysts are all live. SP500 tradingview reference levels updated at 07:16 UTC, 22 May 2026.[8]
Risk Warning: CFDs are complex financial instruments and carry a high risk of losing money rapidly due to leverage. You should ensure you fully understand the risks involved and carefully consider whether you can afford to take the high risk of losing your money before trading.
Disclaimer: The information is provided for educational purposes only and does not take into account your personal objectives, financial circumstances, or needs. It does not constitute investment advice. We encourage you to seek independent advice if necessary. The information has not been prepared in accordance with legal requirements designed to promote the independence of investment research. No representation or warranty is given as to the accuracy or completeness of any information contained within. This material may contain historical or past performance figures and should not be relied on. Furthermore, estimates, forward-looking statements, and forecasts cannot be guaranteed. The information on this site and the products and services offered are not intended for distribution to any person in any country or jurisdiction where such distribution or use would be contrary to local law or regulation.
References
[1] “United States Stock Market Index — Trading Economics.” https://tradingeconomics.com/united-states/stock-market Accessed 22 May 2026.
[2] “Stock Market News for May 21, 2026 — CNBC.” https://www.cnbc.com/2026/05/20/stock-market-today-live-updates.html Accessed 22 May 2026.
[3] “SP500: US Indices Drop as Oil Rebound Shakes Stock Market Forecast — FXEmpire.” https://www.fxempire.com/forecasts/article/sp500-us-indices-drop-as-oil-rebound-shakes-stock-market-forecast-1599374 Accessed 22 May 2026.
[4] “Nvidia Earnings, SpaceX IPO Filing Keep Nasdaq, S&P 500 Futures On Edge — Stocktwits.” https://stocktwits.com/news-articles/markets/equity/nasdaq-sp500-futures-subdued-nvda-tsla-nio-nbis-amd-rklb-stocks-to-watch/cZXzyyMReFW Accessed 22 May 2026.
[5] “S&P 500 Index Surges 1.08% to 7,432 as Oil Collapses and Iran Peace Talks Reach Final Stages — BBN Times.” https://www.bbntimes.com/financial/s-p-500-index-surges-1-08-to-7-432-as-oil-collapses-and-iran-peace-talks-reach-final-stages Accessed 22 May 2026.
[6] “S&P 500 — Quote — Chart — Historical Data — News — Investing.com.” https://www.investing.com/indices/us-spx-500 Accessed 22 May 2026.
[7] “S&P 500 Index Forecast and Analysis 2026 — FXEmpire.” https://www.fxempire.com/indices/s-p-500 Accessed 22 May 2026.
[8] “S&P 500 Index Live Chart — TradingView.” https://www.tradingview.com/symbols/SP500/ Accessed 22 May 2026, 07:16 UTC.
[9] “Nvidia, Fed Minutes on Marquee as Stocks Up Early — Charles Schwab.” https://www.schwab.com/learn/story/stock-market-update-open Accessed 22 May 2026.
