


 Updated
An ascending triangle is a bullish chart pattern formed by a flat horizontal resistance line and an upward-sloping support line connecting a series of higher lows. It indicates that buyers are entering at progressively higher prices while sellers continue to defend the same resistance level.
As the two lines converge, the trading range narrows and pressure builds towards a potential breakout—most commonly, though not always, to the upside.
Although the ascending triangle is generally considered bullish, its inverse structure forms a descending triangle. In this pattern, support remains flat while resistance slopes downward, potentially indicating bearish price pressure.
Recognising a valid formation — and knowing where it tends to fail — is what separates a tradable setup from a false signal.
Key Points
- An ascending triangle forms when a series of higher lows pushes up against a flat resistance level, and a confirmed close above that resistance — ideally on rising volume — is what many traders treat as the breakout signal.
- The pattern leans bullish because it reflects buyers absorbing supply at a fixed ceiling, but false breakouts are common, so waiting for confirmation is generally preferred over anticipating the move.
- A common way to estimate a target is to measure the height of the triangle and project it upward from the breakout point, while a stop-loss below the rising support line defines the risk on the position.
What Is an Ascending Triangle Pattern?
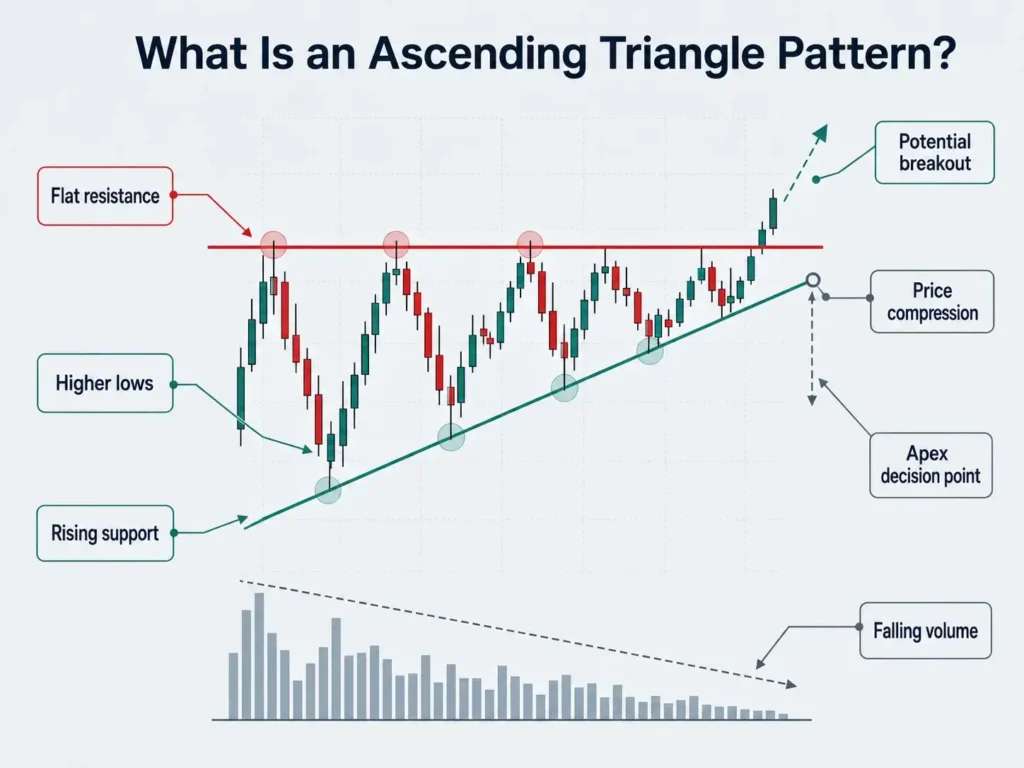
An ascending triangle pattern is a consolidation formation that appears when an asset repeatedly stalls at the same resistance level while finding support at progressively higher lows. The flat top marks a zone where sellers keep offering supply; the rising bottom shows buyers willing to pay up sooner after each pullback.
As price compresses between the two lines, the range narrows towards an apex and the market squeezes towards a decision point. Volume often contracts through this phase, reflecting reduced participation during consolidation.
The pattern sits within the broader family of chart patterns built around support and resistance, and it is usually read as a bullish continuation signal within an existing uptrend — though it can also appear after a downtrend and resolve either way.
Ascending Triangle vs Descending and Symmetrical Triangles
The three triangle types share a converging shape but differ in which boundary is flat and which way the bias leans. An ascending triangle has a flat top and rising bottom; a descending triangle is its mirror image; a symmetrical triangle has two sloping lines and no directional bias until the breakout.
| Triangle type | Upper boundary | Lower boundary | Typical bias | Common breakout direction |
| Ascending triangle | Flat horizontal resistance | Rising support (higher lows) | Bullish-leaning | Often upward |
| Descending triangle | Falling resistance (lower highs) | Flat horizontal support | Bearish-leaning | Often downward |
| Symmetrical triangle | Falling resistance (lower highs) | Rising support (higher lows) | Neutral | Either direction |
Because the ascending triangle carries a directional lean before the breakout, it is often grouped with continuation setups rather than the neutral symmetrical triangle. That said, the shape alone is not a signal — the breakout, and how price behaves around it, is what confirms the move.
Real-World Example: USD/JPY in 2026

USD/JPY offers a more cautionary illustration on the daily chart, and a useful reminder that not every setup resolves the way the textbook expects. From late January into mid-February 2026, USD/JPY CFDs carved out two lows close to the 152.00 level, the second only marginally higher than the first.
From there the pair rallied into a resistance band around 159.50 to 160.50, testing it repeatedly from March through late April — each pullback in between holding at a progressively higher floor, the ascending structure building session by session over roughly two months.
The breakout never came. In early May 2026, instead of clearing resistance, USD/JPY broke decisively below the rising support and fell from around 160.50 to roughly 155.00 within days — a live example of the false-breakout risk discussed above.
The pair later re-based near 155.00 and rallied through May and June to clear the same resistance and reach fresh highs past 162.00 by early July, but that recovery came well after the original pattern had already failed. The episode is a reminder that the ascending triangle’s bullish lean describes a tendency, not a certainty — only a confirmed close through resistance or support validates the move, not the shape alone.
The above example is for illustrative purposes only and does not constitute a recommendation to buy, sell, or hold any financial instrument.
How to Identify an Ascending Triangle Pattern
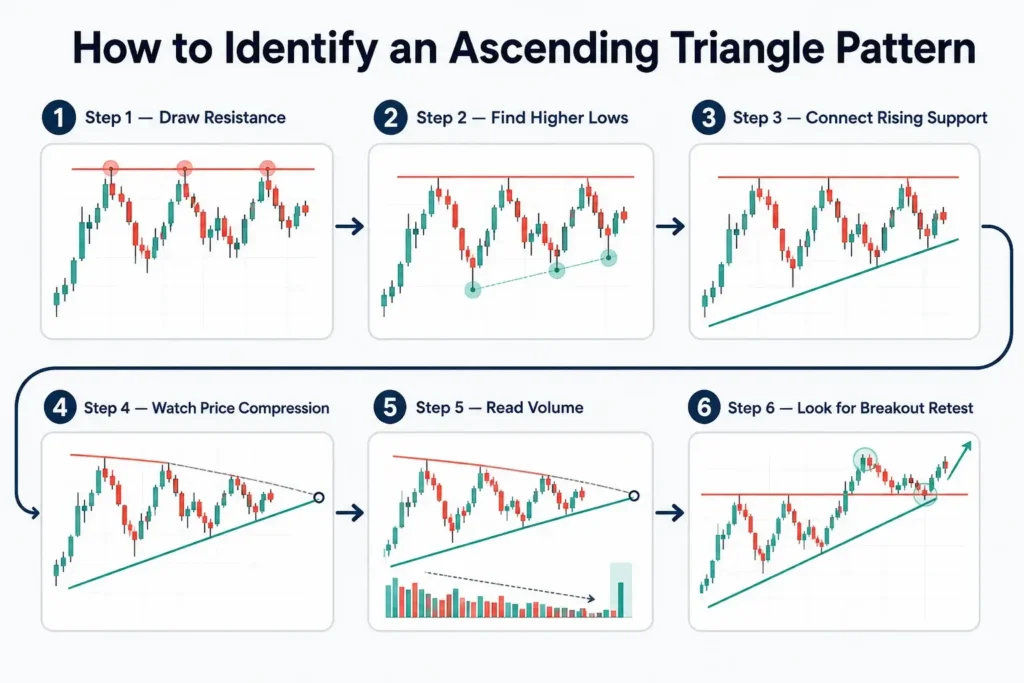
A high-quality ascending triangle has a few structural features worth checking before treating it as tradable. Working through them helps separate a genuine formation from two swing points that only look like a pattern.
Six Key Features to Look For
1. Horizontal Resistance Line
This upper boundary forms where sellers repeatedly defend the same price zone, ideally touched at least twice at similar highs.
- What it represents: A stable area of supply where selling interest keeps capping the advance.
- Implication: Repeated tests without a breakdown suggest persistent buyer interest beneath the ceiling.
- Takeaway: A close above this level may signal a shift of control towards buyers.
2. Rising Support Trendline
A rising line connects the pattern’s higher lows, and it usually needs at least two progressively higher troughs to be valid.
- What it represents: Buyers becoming more assertive and entering earlier after each dip.
- Implication: A clean progression of higher lows strengthens the bullish bias.
- Takeaway: A decisive break below this trendline weakens or invalidates the pattern.
3. Converging Trendlines
As rising support approaches flat resistance, the triangle narrows towards its apex.
- What it represents: Compressing momentum and a build-up of pressure between the two sides.
- Implication: Price moves often become more decisive as the range tightens near the apex.
- Takeaway: A breakout in either direction tends to become more likely as space runs out.
4. Duration
Ascending triangles can form over very different timeframes, and the larger the timeframe, the more significant the pattern is generally considered.
- Shorter formations: Often appear on intraday charts during momentum-driven phases.
- Longer formations: Tend to appear on daily, weekly or monthly charts, reflecting steadier accumulation.
5. Volume
Volume often contracts as the triangle forms, then a successful breakout may occur alongside an increase in volume, which can indicate stronger engagement behind the move. Volume behaviour varies by instrument and timeframe, so it is best read within the broader context rather than as a standalone signal.
6. Return to Breakout (Retest)
After breaking above resistance, price may return to test the old ceiling as new support before continuing.
- What it represents: Buyers defending the breakout level and establishing it as a new floor.
- Implication: A successful retest can reinforce the validity of the breakout.
- Takeaway: Some traders prefer to wait for a retest rather than chasing the initial breakout candle.
How to Tell Whether It Will Continue or Reverse
An ascending triangle can lead to continuation or reversal depending on where it appears and how price and volume behave at the decision point. When the pattern forms within an existing uptrend, signs that often support a bullish continuation include a full-bodied close above resistance rather than a brief wick, a pick-up in volume against recent consolidation, and a successful retest that holds above the former ceiling.
A reversal to the downside becomes more likely when buyers cannot sustain momentum near resistance. Common warning signs include a decisive break below the rising trendline, false breakouts that close back inside the pattern, a lower high that fails to retest resistance with equal strength, and momentum indicators such as the RSI and MACD turning lower.
None of these guarantees an outcome, and reversals can unwind quickly, which is why risk management stays central to trading the pattern.
The Market Psychology Behind the Ascending Triangle
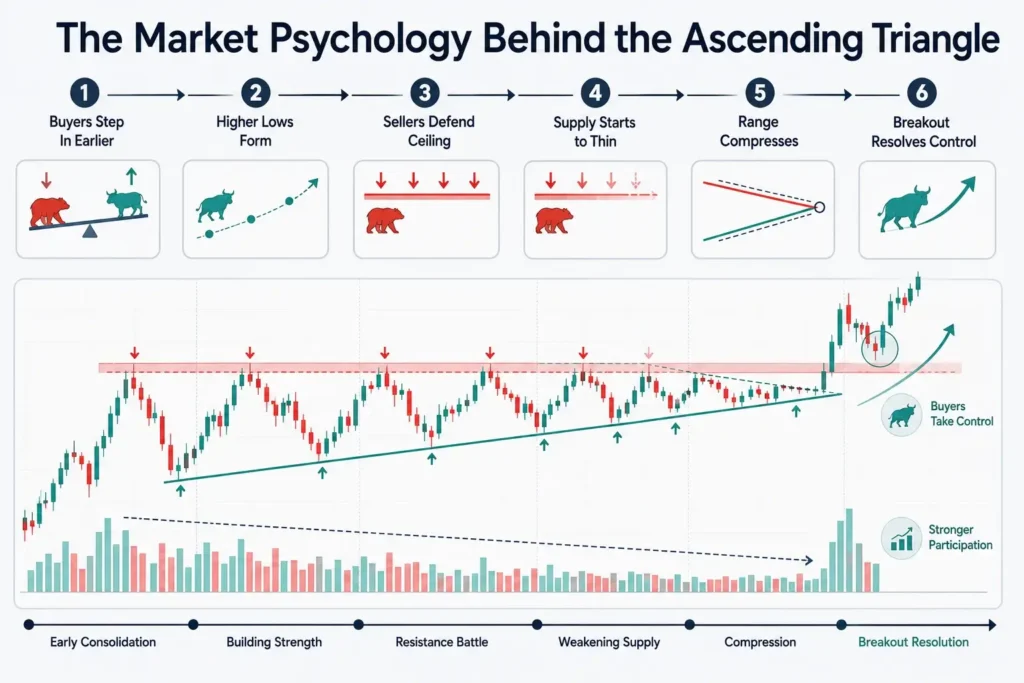
Price patterns often reveal a shift in supply and demand before a breakout actually happens. The ascending triangle captures this by showing how participants respond to repeated tests of support and resistance over time.
- Buyers grow more confident: They begin stepping in at progressively higher levels, willing to accumulate positions sooner after each dip.
- Higher lows form a rising floor: Each pullback finds support earlier than the last, reflecting increasing conviction on the buy side.
- Sellers defend a fixed ceiling: Every rally stalls at the same resistance, marking a supply zone that holds firm at first.
- Supply starts to thin: Price returns to resistance more frequently and with less downward follow-through, suggesting sellers are struggling to absorb demand.
- The range compresses: As support rises and resistance holds, sentiment tilts towards buyers and a decisive move tends to follow once one side asserts control.
- The breakout resolves it: A break above resistance on rising participation suggests buyers have taken over, while a weak or low-volume breakout raises the odds of a failed move.
Read this way, the ascending triangle visualises how sentiment shifts during consolidation — the gradual transfer of strength from sellers to buyers — which is exactly why the breakout, not the shape alone, carries the signal.
Common Approaches to Trading the Ascending Triangle Pattern
The approaches below are general educational frameworks, not recommendations, and should be adapted to individual circumstances and market conditions. Whichever entry a trader considers, the pattern is usually accessed through a CFD position on the underlying — a share, index, currency pair or commodity — so both the potential gain and the potential loss are amplified by leverage.
Two Common Entry Methods
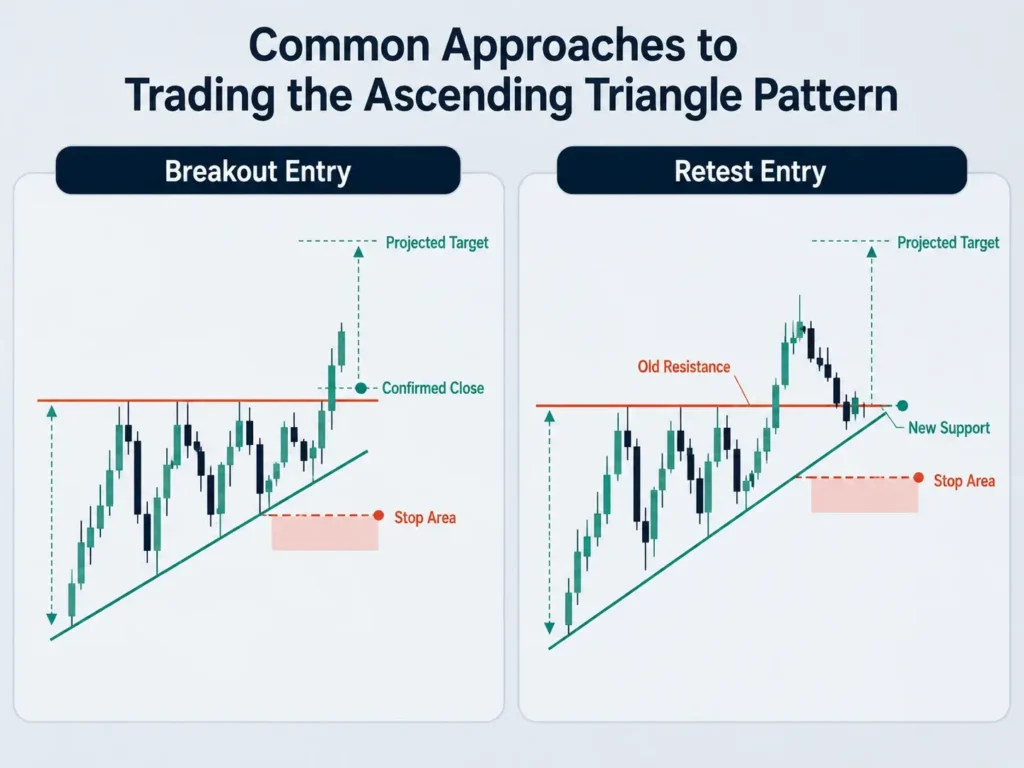
1. Breakout Entry Approach
Some traders open a long CFD position once price breaks above resistance and closes firmly outside the triangle, treating that close as confirmation that buyers have taken control.
- Entry: After a confirmed close above resistance rather than an intrabar spike.
- Stop-loss: Commonly placed below the rising support line or a recent swing low.
- Profit target: Often estimated from the height of the triangle projected up from the breakout level.
2. Retest Entry Approach
A more conservative approach waits for the breakout, then looks to enter on the retest if the old resistance holds as new support — which can offer a clearer read on buyer strength.
- Entry: When price retests the former resistance and shows signs of stabilising.
- Stop-loss: Typically placed beneath the retest support area.
- Profit target: The triangle height projected upward from the breakout area, as above.
Estimating a Target and Framing Risk and Reward
A widely used method to estimate the ascending triangle target is to measure the triangle’s height — the distance between resistance and the initial low — and project that distance upward from the breakout point, as described in StockCharts ChartSchool [1]. It gives a rough guideline, not a precise forecast.
In a hypothetical example, an instrument meets resistance at 100 with a first low at 90, giving a triangle height of 10. Projected from a breakout at 100, that points to an estimated target near 110. Measured against a stop-loss placed below the rising support around 88, the setup frames a reward-to-risk ratio of roughly 5 to 2. This example is hypothetical and for illustrative purposes only. It does not reflect actual trading results or client experiences.
Framing every setup by its reward-to-risk ratio, rather than the target alone, keeps position sizing tied to the risk being taken. A favourable ratio does not make a trade more likely to work — it only shapes the payoff if it does, and the loss if it does not.
Using Confirmation Tools Alongside the Pattern
Technical tools can add context around momentum and trend strength, but they are best used together rather than as standalone signals. The pattern is often read alongside several of the following:
- Relative Strength Index (RSI): A rising RSI or readings above the midpoint of 50 may point to bullish momentum, while very high readings can flag stretched conditions.
- Moving averages (MAs): Price trading above rising short- or medium-term averages, such as the 20-day or 50-day MA, can support the idea of an ongoing uptrend, though it works better as context than confirmation.
- MACD: A bullish MACD crossover or expanding histogram aligned with the breakout direction may suggest momentum is behind the move.
- Bollinger Bands: Price pushing towards or above the upper band during a breakout can indicate rising volatility and activity, to be read with other factors.
- Volume: A clear increase in volume on the breakout may point to broader participation, while thin volume can raise caution about a potential failure.
Applying the Ascending Triangle Across CFD Markets
The ascending triangle is not tied to one asset class. Because it describes buyer and seller behaviour rather than a specific instrument, the same structure shows up on forex CFDs, share CFDs, index CFDs and commodity CFDs such as gold. What changes between them is the character of the breakout, not the shape.
- Forex CFDs: Majors tend to produce cleaner, more liquid breakouts, though spreads can widen around major economic releases.
- Share CFDs: Individual stocks can gap around earnings or news, so a resistance ceiling may be cleared or broken abruptly rather than gradually.
- Index and commodity CFDs: Instruments like gold or major indices often form longer, higher-timeframe triangles that can take weeks to resolve.
Across all of them the leverage in a CFD magnifies both directions equally, so the wider the instrument’s typical range, the more carefully the stop distance and position size need to be matched to it. The pattern reads the same; the risk does not.
Is the Ascending Triangle Pattern Reliable?
The ascending triangle is widely recognised in technical analysis, but like any chart pattern its usefulness depends on market conditions, the quality of the structure, and confirmation. The table below summarises the commonly discussed strengths and limitations.
| Strengths | Limitations |
| Clear, easily recognisable structure | False breakouts can and do occur |
| Works across multiple timeframes and markets | Can be confused with similar patterns |
| Defined levels for entry and invalidation | Often needs volume to confirm the breakout |
| Supports both continuation and reversal reads | Breakout timing can be unpredictable |
Avoiding Common Misidentifications
Several patterns can resemble an ascending triangle, and telling them apart lowers the chance of a false read:
- Ascending broadening pattern: The trendlines widen rather than converge, creating higher highs and higher lows with rising volatility.
- Rising wedge: Both trendlines slope upward, and the rising wedge pattern often resolves bearishly as upward momentum fades.
- Symmetrical triangle: There is no flat resistance line; both trendlines slope inward at similar angles, leaving the bias neutral.
The defining test is simple: an ascending triangle pairs a flat resistance line with rising support. If the top is not roughly horizontal, it is probably a different pattern.
Common Mistakes Traders Make
Recurring errors with the pattern tend to cluster around a few habits:
- Misreading the structure, such as confusing it with a rising wedge or symmetrical triangle.
- Entering without confirmation, acting before price convincingly clears or holds a key level.
- Over-relying on the pattern alone, without weighing trend strength, volume or broader conditions.
- Ignoring false breakouts, which occur when momentum fails to support the initial move.
Applying the Ascending Triangle Pattern
The ascending triangle offers a structured way to read how supply and demand evolve as a market approaches a potential breakout. Its defining features — flat resistance, rising support, a narrowing range and shifting volume — give a clear picture of how participants are positioning.
It works best as one input among several. No single pattern is predictive on its own, and its effectiveness depends on the trend, volatility, liquidity and confirmation from other tools. Pairing it with risk management and a multi-tool approach gives a more balanced view of whether a breakout is likely to follow through or fail.
For those wanting to study the pattern in live conditions, a Vantage demo account allows practice in a simulated environment without risking real capital. Its charting is powered by TradingView, which some traders find useful for identifying patterns such as ascending triangles as they form.
Frequently Asked Questions (FAQs)
What is the ascending triangle pattern?
An ascending triangle is a chart pattern formed by a flat horizontal resistance line at the top and a rising support trendline of higher lows at the bottom. As price oscillates between the two, the range tightens and pressure builds towards a potential breakout. It usually appears within an uptrend and is read as a bullish continuation signal, though it can also form after a downtrend and resolve either way depending on broader market context.
Is an ascending triangle bullish or bearish?
An ascending triangle is generally viewed as bullish-leaning, because higher lows meeting a flat ceiling reflect rising buying interest over time. The bias is not a guarantee, however. Market conditions, volatility and volume all influence whether the pattern resolves upward, breaks down, or fails to complete, so many traders wait for a confirmed breakout before treating the bias as directional.
How do you trade an ascending triangle pattern?
Two common approaches are entering after a confirmed close above resistance, or waiting for a retest of that level as new support before entering. In both cases a stop-loss is often placed below the rising support line, and a target is commonly estimated by projecting the triangle’s height from the breakout point. These are general frameworks rather than rules, and every position through a CFD carries the risk of amplified losses from leverage.
How do you calculate the target for an ascending triangle breakout?
The usual method is to measure the height of the triangle — the vertical distance between the flat resistance and the lowest point of the pattern — and add that distance to the breakout level. If resistance sits at 100 and the pattern is 10 wide, the projected target would be around 110. This gives an estimate only, and is best combined with other technical tools and a defined invalidation level.
What is the best timeframe for the ascending triangle pattern?
There is no single best timeframe, as the pattern appears on intraday, daily and weekly charts. Many traders find it reads more clearly on higher timeframes, where price action tends to be smoother and less affected by short-term noise. Regardless of timeframe, it is best evaluated alongside volume and broader market conditions rather than in isolation.
What common mistakes should traders avoid with this pattern?
The most frequent mistakes are misidentifying the structure, entering before price convincingly interacts with a key level, over-relying on the pattern without checking trend strength or volume, and ignoring the risk of false breakouts. These points are general indicators rather than fixed rules, and the pattern is best used as part of a broader analysis framework.
References
- “#6: Moving Average Trading Secrets – TradingWithRayner”. https://www.tradingwithrayner.com/course/moving-average-trading-secrets/. Accessed on 3 December 2025.