Oil Prices Today: Brent Near $99 as Hormuz Talks Stall and OPEC+ Meets 7 June
Vantage Editorial Team >
Vantage Editorial Team >
Vantage is a global, multi-asset broker with a team of in-house writers and market analysts who produce educational and insightful trading content for traders of all levels.

Brent crude oil (UKOUSD) was trading near $98.89 per barrel and WTI crude oil (USOUSD) near $96.37 per barrel as of 03:20 UTC on 3 June 2026, per the Vantage CFD feed. Both benchmarks are consolidating below the 1 June intraday peak, which briefly pushed Brent above $100.00 before reversing almost as quickly.
The oil price chart tells a market caught between two opposing forces: a geopolitical risk premium that continues to support prices, and a softening demand picture pressing from above. All prices are as of 03:20 UTC, 3 June 2026 (11:20 GMT+8). Charts from TradingView via the Vantage platform. This is not financial advice.
Key points
- Brent (UKOUSD CFD) last traded near $98.89 and WTI (USOUSD CFD) near $96.37 as of 03:20 UTC on 3 June 2026, holding above last week’s range but below the 1 June intraday peak.
- Iran’s decision to suspend indirect communications with Washington on 1 June 2026 coincided with a surge that briefly pushed Brent above $100; prices pulled back after Trump confirmed negotiations were still ongoing.[1]
- OPEC+’s seven-member group meets on 7 June 2026 to review output policy, having raised the June quota by 188,000 barrels per day at their 3 May meeting — the third consecutive monthly increase.[2]
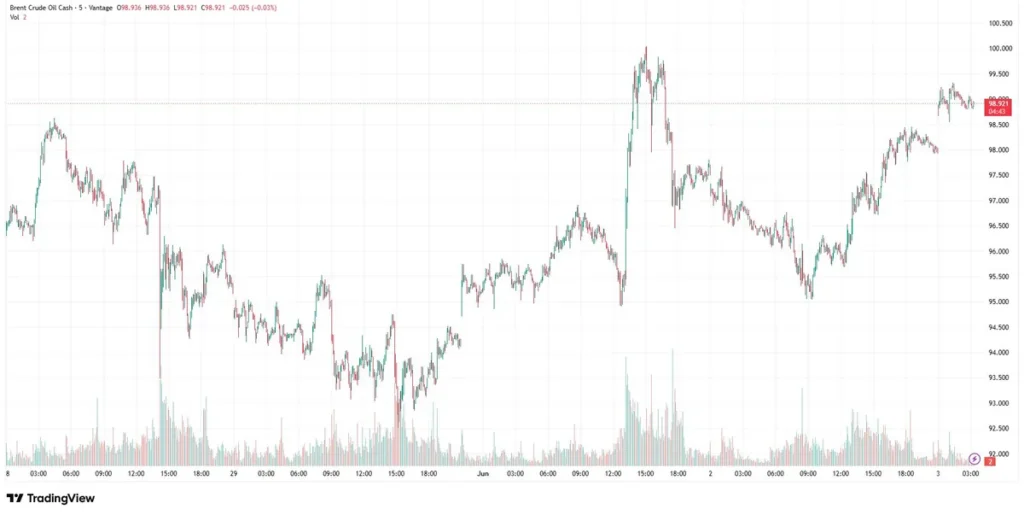
What the Brent crude oil price chart is showing
The Vantage UKOUSD CFD 5-minute chart spans 28 May to 3 June 2026. Brent spent most of late May consolidating between approximately $93.00 and $95.50, with relatively steady activity on the Vantage CFD feed. The picture changed sharply on 1 June when prices spiked to near $100.00 intraday.
That move coincided with Iranian media reports that Tehran had suspended indirect communications with Washington.[1] A swift reversal pulled Brent back toward $95.00 before buyers returned. As of 03:20 UTC on 3 June, Brent last traded near $98.87, just below a dotted horizontal reference visible at $98.94.
What the WTI crude oil price chart is showing
The Vantage USOUSD CFD 5-minute chart mirrors Brent’s pattern. WTI ranged between roughly $89.00 and $91.50 through late May before spiking to near $96.50 on 1 June. The move reversed sharply, then partially recovered. WTI last traded near $96.37 at the chart’s cut-off. Volume on the Vantage CFD feed was notably elevated around the 1 June event, then eased.

Three forces shaping oil prices today
1. The Strait of Hormuz — the dominant variable
The ongoing Middle East conflict has kept the Strait of Hormuz effectively closed to most commercial shipping since late February 2026. Before the conflict, roughly one-fifth of globally traded oil and LNG transited the strait.[3] According to marine traffic data cited by the United Against Nuclear Iran monitoring group, open transits fell to near zero vessels per day after 6 May, down from around 138 vessels transiting daily before hostilities began.[4]
Brent fell nearly 19% across May, its sharpest monthly decline since the Covid-19 period, as ceasefire talks raised hopes that shipping lanes could gradually reopen.[5] That narrative shifted on 1 June when Iranian media reported that Tehran suspended indirect talks with Washington, and that Iran and its regional allies were considering the further closure of the Bab el-Mandeb Strait, a key alternative shipping route.[1]
The IEA has described the halt in Hormuz traffic as the largest oil supply disruption in the history of global energy markets.[3] Until vessel traffic through the region shows a material improvement, the conflict risk premium is likely to remain a live factor in crude oil prices today.
2. OPEC+ output — quotas on paper, barrels harder to deliver
Seven OPEC+ members (Saudi Arabia, Russia, Iraq, Kuwait, Kazakhstan, Algeria, and Oman) raised the June 2026 output quota by 188,000 barrels per day at their 3 May meeting, the third consecutive monthly increase.[2] The group’s next meeting is 7 June 2026.[2]
In practice, the supply increase is primarily a quota signal rather than an immediate physical uplift. Saudi Arabia’s June quota was raised to 10.291 million barrels per day, while actual Saudi production in March was reported at around 7.76 million barrels per day.[6] With the Strait of Hormuz subject to severe disruption, getting Gulf barrels to buyers remains constrained regardless of the headline quota figure.
3. IEA demand outlook — the quiet counterweight
The IEA’s April 2026 Oil Market Report, published on 14 April 2026, projected global oil demand to decline by 80,000 barrels per day in 2026 compared to 2025 — a revision of 730,000 barrels per day relative to its previous monthly report.[7] The IEA projected a 1.5 million barrels per day demand contraction in Q2 2026, which it described as the sharpest quarterly decline since Covid-19 slashed fuel consumption.[7]
This demand picture sits in direct tension with the conflict-driven supply squeeze. Crude oil prices today are effectively navigating between geopolitical risk holding a floor and softening consumption data applying pressure from above.
Levels to watch
| Instrument | Support | Resistance | Context — 03:20 UTC, 3 June 2026 |
| UKOUSD (Brent) | $93.00 / $95.50 | $100.00 / $102.00 | Near $98.92; consolidating below the $98.94 reference level |
| USOUSD (WTI) | $91.50 / $93.00 | $97.50 / $99.00 | Near $96.41; holding above the late-May consolidation range |
Table 1: Reference levels as of 03:20 UTC, 3 June 2026. Sources: Vantage CFD feed, TradingView. Indicative only.
What to watch this week
- OPEC+ monthly meeting, 7 June 2026: The group reviews market conditions and output policy. Any guidance on July quota or change to the pace of supply increases will be closely watched by oil markets.
- US-Iran diplomatic signals, Ongoing: Any credible progress toward a Hormuz shipping agreement could shift crude positioning materially. Fresh escalation has historically coincided with sharp intraday moves on both Brent and WTI oil prices.
- EIA Weekly Crude Inventories, 4 June 2026 (est.): US inventory data is a secondary but relevant input for WTI. A significant build or draw could amplify any diplomatic headline move.
- IEA Oil Market Report, Mid-June 2026: The next monthly update will revise demand projections. Any further downward revision to 2026 consumption would add additional context to current oil price levels.
Risk management
The 1 June 2026 spike illustrates how quickly crude oil prices can move on a single diplomatic headline. Brent covered roughly $5.00 in a short window before reversing. Traders holding UKOUSD or USOUSD positions should ensure Stop Loss placement accounts for this kind of intraday range rather than assuming prior-week volatility as a baseline.
The $93.00 and $91.50 areas on Brent and WTI respectively have recently acted as support; the spike highs near $100.00 and $97.50 represent the upper end of the current observed range.
Crude oil CFDs involve leverage, which amplifies both potential returns and potential losses relative to your account balance. Reviewing position sizing relative to account equity before scheduled event risk — such as the 7 June OPEC+ meeting — is a prudent step. CFDs are complex instruments and you should ensure you fully understand how leverage works before trading.
RISK WARNING: CFDs are complex financial instruments and carry a high risk of losing money rapidly due to leverage. You should ensure you fully understand the risks involved and carefully consider whether you can afford to take the high risk of losing your money before trading.
Disclaimer: The information is provided for educational purposes only and doesn’t take into account your personal objectives, financial circumstances, or needs. It does not constitute investment advice. We encourage you to seek independent advice if necessary. The information has not been prepared in accordance with legal requirements designed to promote the independence of investment research. No representation or warranty is given as to the accuracy or completeness of any information contained within. This material may contain historical or past performance figures and should not be relied on. Furthermore estimates, forward-looking statements, and forecasts cannot be guaranteed. The information on this site and the products and services offered are not intended for distribution to any person in any country or jurisdiction where such distribution or use would be contrary to local law or regulation.
References
[1] “Brent crude oil price and news — Trading Economics” https://tradingeconomics.com/commodity/brent-crude-oil Accessed on 3 June 2026.
[2] “OPEC+ announces 188,000 bpd output increase — CNBC” https://www.cnbc.com/2026/05/03/opec-announces-188000-barrels-per-day-output-increase-.html Accessed on 3 June 2026.
[3] “When will Strait of Hormuz be safe for commercial shipping again? — Al Jazeera” https://www.aljazeera.com/features/2026/4/28/when-will-strait-of-hormuz-be-safe-for-commercial-shipping-again Accessed on 3 June 2026.
[4] “Iran War Shipping Update, 11 May 2026 — United Against Nuclear Iran (UANI)” https://www.unitedagainstnucleariran.com/blog/iran-war-shipping-update-may-11-2026 Accessed on 3 June 2026.
[5] “Oil drops 20% from 2026 peak on optimism over US-Iran ceasefire talks — CNBC” https://www.cnbc.com/2026/05/29/oil-prices-iran-ceasefire-us-trump-strait-hormuz-energy-costs.html Accessed on 3 June 2026.
[6] “OPEC+ announces symbolic oil output rise during Strait of Hormuz closure — Al Jazeera” https://www.aljazeera.com/news/2026/5/3/opec-announces-symbolic-oil-output-rise-during-strait-of-hormuz-closure Accessed on 3 June 2026.
[7] “Oil Market Report, April 2026 — International Energy Agency (IEA)” https://www.iea.org/reports/oil-market-report-april-2026 Accessed on 3 June 2026.
[8] “Global oil demand to plunge amid Middle East war disruptions — Al Jazeera” https://www.aljazeera.com/news/2026/4/14/global-oil-demand-to-plunge-amid-middle-east-war-disruptions Accessed on 3 June 2026.
[9] “How traffic through the Strait of Hormuz shrank to a trickle — CNN” https://www.cnn.com/2026/04/29/world/iran-war-gulf-hormuz-shipping-maps-intl-vis Accessed on 3 June 2026.
[10] “Oil drops 20% from 2026 peak — CNBC (Brent May performance)” https://www.cnbc.com/2026/05/29/oil-prices-iran-ceasefire-us-trump-strait-hormuz-energy-costs.html Accessed on 3 June 2026.
