[DAILY TRADING] XAUUSD Analysis 3 June 2026 — Gold Price Today Stuck Below $4,500 as Iran Talks Stall and NFP Looms
Vantage Editorial Team >
Vantage Editorial Team >
Vantage is a global, multi-asset broker with a team of in-house writers and market analysts who produce educational and insightful trading content for traders of all levels.
![[DAILY TRADING] XAUUSD Analysis 3 June 2026 — Gold Price Today Stuck Below $4,500 as Iran Talks Stall and NFP Looms](https://www.vantagemarketsea.com/wp-content/uploads/2026/05/XAUUSD_banner_900x430_optimized.webp)
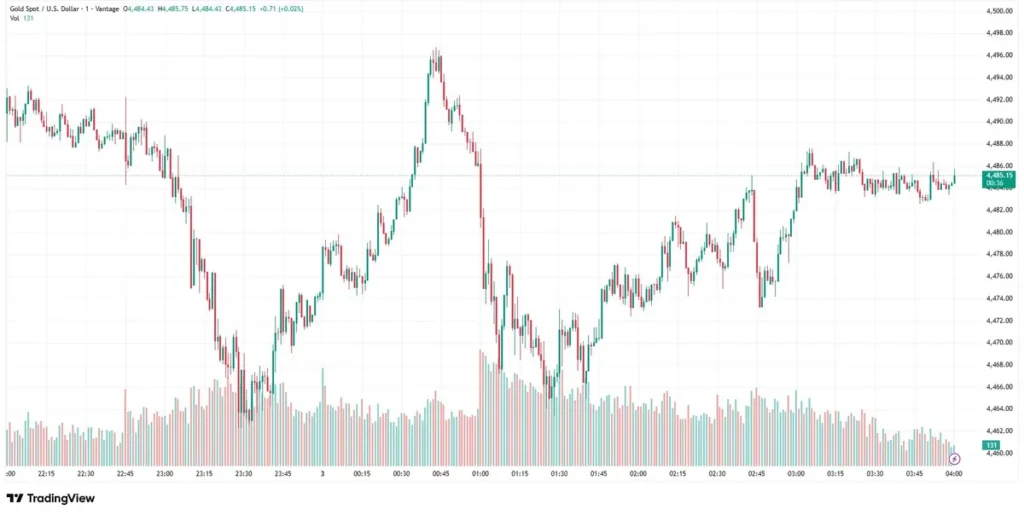
The gold price today on the Vantage XAUUSD CFD was near $4,485 as of 04:00 UTC on 3 June 2026, down approximately 0.27% from the prior UTC close, and trapped below the $4,500 mark for a second consecutive day.[1] A $37 intraday swing shaped the session: a sharp drop to around $4,462, a spike recovery to roughly $4,495, then choppy consolidation. Two forces drove it — stalled US-Iran peace talks and a week packed with US labour market data.
All prices reference the Vantage XAUUSD CFD as of 04:00 UTC, 3 June 2026. Charts are indicative and from TradingView. This is not financial advice.
Key Points
- The Vantage XAUUSD CFD dropped to a session low near $4,462 before recovering to around $4,495, then settled near $4,485 by 04:00 UTC on 3 June 2026, down approximately 0.27% from the prior UTC close.[1]
- Iran’s reported suspension of communications with Washington coincided with gold’s early session selloff. President Trump countered that talks are ongoing and a Strait of Hormuz agreement could come as early as next week.[1]
- The XAUUSD price trend this week is shaped by JOLTS April job openings data, released on 2 June at approximately 7.6 million (verify against BLS or Reuters), reinforcing labour market resilience, alongside ADP employment and ISM Services PMI on 3 June, and the headline May Nonfarm Payrolls (NFP) report on 5 June.[2]
What the XAUUSD Chart Is Showing
The 1-minute chart for the Vantage XAUUSD CFD captures a textbook volatility pattern: a sharp directional move, an equally sharp counter-move, then a range-bound consolidation as the market waited for the next catalyst.
Price opened near $4,491 and sold off steadily to approximately $4,462 around 23:30 UTC on 2 June, a move of around $31 with elevated volume on the Vantage CFD feed. A sharp recovery followed, pushing the XAU/USD price to the session high near $4,495 around 00:45 UTC on 3 June. Sellers re-emerged there, pulling price back toward $4,464 before a second, shallower recovery settled price into the $4,482–$4,487 band by 04:00 UTC.
On the daily chart, the RSI from the TradingView daily chart used for this analysis sits in the 38–44 range, below the neutral 50 line, while price appears capped under the 50-day SMA (indicatively near $4,629 on the daily chart) and the 100-day SMA (indicatively near $4,800, subject to verification). The 200-day SMA at approximately $4,416 on the TradingView daily chart is the first meaningful downside reference. All SMA values are indicative and should be verified directly on TradingView prior to trading decisions.[3]
Why Gold Market News Is Keeping Traders on Edge
Iran: Talks Stall, Oil Stays Elevated
According to reports cited by Trading Economics, Iranian media reported that Tehran suspended communications with Washington following Israeli strikes in Lebanon and Gaza. That headline coincided with gold’s early drop.[1] Trump stated talks are ongoing and that a Strait of Hormuz memorandum of understanding could follow within days, pulling the market back the other way.[1]
With the Strait closure having disrupted around 20% of globally traded oil flows earlier in the conflict, energy-driven inflation remains the key macro constraint.[1] Some market participants are pricing in a Fed rate hike before year-end as a tail risk rather than a base case, a hawkish-leaning backdrop that continues to limit the upside for non-yielding assets including gold.[3]
A Data-Heavy Week for the Gold Price Outlook
The XAU/USD price is exposed to several high-impact data points this week. April JOLTS job openings, released on 2 June, came in at approximately 7.6 million according to Trading Economics, the highest level in nearly two years, pointing to continued labour market resilience. Verify the final figure against the BLS release or Reuters before publication. ADP Employment Change and ISM Services PMI follow on 3 June, with the centrepiece May NFP report on 5 June.[2]
A strong labour market reading tends to reinforce the “higher for longer” Fed narrative, which has historically weighed on gold. A softer result shifts that calculus. Both scenarios carry meaningful implications for the XAUUSD price in the near term.
Key Levels on the XAUUSD Price Today
Reference levels on the Vantage XAUUSD CFD as of 04:00 UTC, 3 June 2026. These are not trade signals.
| Zone | Level | Context |
| Session High | ~$4,497 | Spike high, 3 June ~00:45 UTC |
| Current range | $4,482–$4,487 | Consolidation band as of 04:00 UTC |
| Session Low / Near support | ~$4,460 | Tested in Asian session selloff |
| 200-day SMA (daily) | ~$4,416 (approx.) | First meaningful downside reference [3] |
| 50-day SMA (daily) | ~$4,629 | Overhead resistance capping recovery [3] |
Table 1: Key levels, Vantage XAUUSD CFD, as of 04:00 UTC 3 June 2026. Sources: Vantage XAUUSD CFD, TradingView, FXStreet. Indicative only.
What to Watch
The events most likely to move the XAUUSD price this week:
- ADP + ISM Services PMI, 3 June: Early read on private employment and services activity ahead of Friday’s headline number.
- JOLTS Job Openings, 2 June (released): April openings came in at approximately 7.6 million, the highest in nearly two years, reinforcing the “higher for longer” Fed narrative that has weighed on gold in recent sessions. Verify final figure against the BLS release prior to publication.
- May NFP, 5 June: The week’s main event. Any outcome, beat or miss, is likely to produce a meaningful move in the XAU/USD price.
- US-Iran Negotiations, Ongoing: Any credible signal on the Strait of Hormuz could shift the inflation narrative and alter gold’s geopolitical floor.
The Vantage XAUUSD CFD saw a $37 intraday range on 3 June, unusually wide for a consolidating session. In headline-driven markets, Stop Loss placement around the $4,460 session low and the $4,497 session high matters more than usual. Traders holding correlated positions across gold and related instruments should review combined exposure before each data print this week.
Leverage amplifies both gains and losses. With NFP and multiple labour market prints due before Friday, revisiting position sizing relative to account equity before each release is worth the time. Trading CFDs with leverage carries a high risk of loss and may not be suitable for all traders.
RISK WARNING: CFDs are complex financial instruments and carry a high risk of losing money rapidly due to leverage. You should ensure you fully understand the risks involved and carefully consider whether you can afford to take the high risk of losing your money before trading.
Disclaimer: The information is provided for educational purposes only and doesn’t take into account your personal objectives, financial circumstances, or needs. It does not constitute investment advice. We encourage you to seek independent advice if necessary. The information has not been prepared in accordance with legal requirements designed to promote the independence of investment research. No representation or warranty is given as to the accuracy or completeness of any information contained within. This material may contain historical or past performance figures and should not be relied on. Furthermore estimates, forward-looking statements, and forecasts cannot be guaranteed. The information on this site and the products and services offered are not intended for distribution to any person in any country or jurisdiction where such distribution or use would be contrary to local law or regulation.
References
[1] “Gold — Price — Chart — Historical Data — News (gold price 3 June 2026, Iran ceasefire developments, Strait of Hormuz) — Trading Economics” https://tradingeconomics.com/commodity/gold Accessed on 3 June 2026.
[2] “Gold Weakens Below $4,500 as Strong JOLTS Data Reinforces Elevated Rate Expectations — Trading Economics” https://tradingeconomics.com/commodity/gold Accessed on 3 June 2026.
[3] “Gold Trades Within Familiar Range as Traders Weigh US-Iran Developments and Fed Outlook — FXStreet” https://www.fxstreet.com/news/gold-rises-within-familiar-range-as-trump-says-us-iran-talks-continue-at-a-rapid-pace-202606021215 Accessed on 3 June 2026.
