


[DAILY TRADING] Nikkei 225 Analysis 17 July 2026 – Index Falls Below 65,000 as Chip Stocks Sink

Vantage Editorial Team >
Vantage Editorial Team >
Vantage is a global, multi-asset broker with a team of in-house writers and market analysts who produce educational and insightful trading content for traders of all levels.
 Updated Fri, 2026 July 17 06:21
![[DAILY TRADING] Nikkei 225 Analysis 17 July 2026 – Index Falls Below 65,000 as Chip Stocks Sink](https://www.vantagemarketsea.com/wp-content/uploads/2026/06/Nikkei225_Hero_29May2026.webp)
The Nikkei 225, also widely searched as Nikkei225 or the Nikkei share index, broke below the 65,000 level on 17 July 2026, extending a two-day slide that has wiped out more than 4,000 points since Wednesday’s close.
In today’s Nikkei 225 news, the Vantage Japan Index Cash CFD traded near 63,465.53 as of the cut-off time of 12:46 (GMT+8), 04:46 UTC, having fallen as much as 4.4% intraday to touch 63,896.48 earlier in the session. [1][2]
The Nikkei index today reflects a broader semiconductor-led selloff that began on Wall Street before spreading across Asian markets. [3][4]
This article examines the current chart structure and today’s market drivers, without forecasting where the index goes next. All figures below are indicative and for informational purposes only.
What the chart is showing
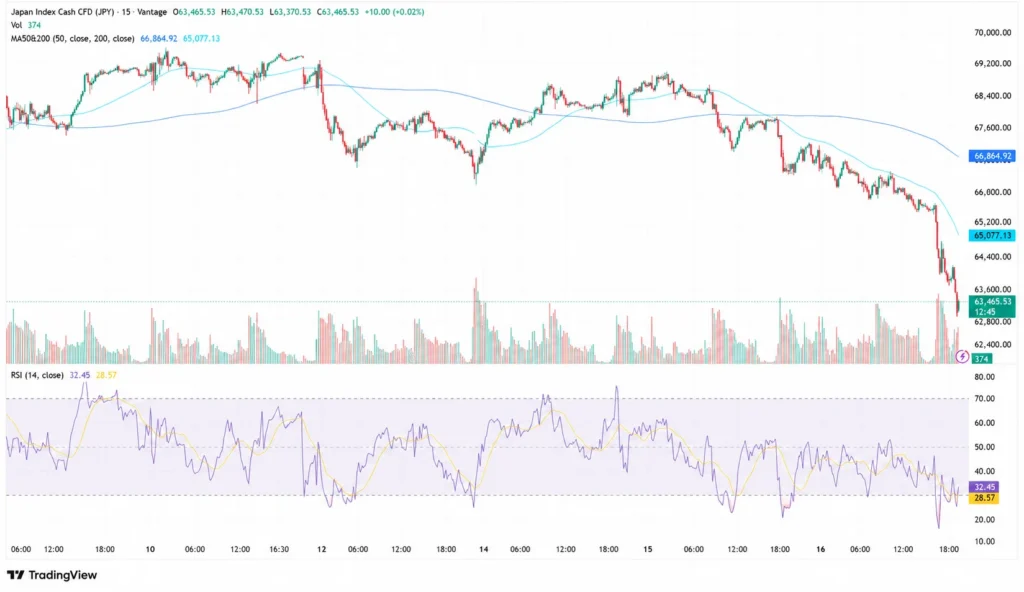
On the 15-minute Vantage Japan Index Cash CFD (JPY) chart, the benchmark behind Japan’s Nikkei stock market, the current candle opened at 63,465.53, ranged between 63,370.53 and 63,470.53, and closed near the same level, up a marginal 0.02% on the bar. Volume on the candle stood at 374, per the Vantage CFD feed.
The chart’s moving-average overlay shows the 50-period MA at 66,864.92 and the 200-period MA at 65,077.13, based on the header legend of the TradingView setup used for this analysis. Price now sits below both averages, a clear deterioration in short-term momentum from the consolidation seen through most of last week, when the index oscillated broadly between 67,600 and 69,200.
The Relative Strength Index reads 32.45, with its moving-average overlay at 28.57, both sitting in the lower half of the oscillator’s range, per the TradingView setup used for this analysis. RSI dipped below the 30 oversold threshold earlier in the session before recovering slightly, a reflection of how fast the decline has moved rather than a specific reversal signal.
Why the Nikkei is under pressure today
The pressure on the Nikkei market index traces back to Wall Street’s Thursday session, where the S&P 500 slipped 0.51% to 7,533.77 and the Nasdaq Composite fell 1.47% to 25,881.95 on renewed semiconductor weakness. [3][4]
Despite reporting record quarterly earnings, Taiwan Semiconductor Manufacturing Co.’s higher 2026 capital expenditure guidance, between $60 billion and $64 billion, reinforced investor concerns that AI-related spending may be peaking, pressuring semiconductor shares broadly. [3]
That unease carried into Asian trading, where SK Hynix fell more than 11% in Seoul, Samsung Electronics dropped over 7%, and in Tokyo, Advantest, SoftBank Group, and Tokyo Electron each declined 5% to 7%. [4]
The Nikkei 225 closed Thursday down 2.79%, or 1,915.97 points, at 66,835.54, erasing virtually all of Wednesday’s 1,008-point rally. [1][6]
The selloff deepened further on Friday. The Nikkei 225 index traded as much as 4.4% lower intraday, touching 63,896.48. Around 70% of listed shares on the Tokyo Stock Exchange were declining during the session. [2][5]
Chip-equipment maker Advantest and technology investor SoftBank Group each lost close to 9% during the session, while memory chipmaker Kioxia dropped around 16%, extending a slide that has erased close to 44% of its value over the past month. [2]
Reuters also flagged an escalating Middle East conflict as a separate factor weighing on risk appetite across Asian equities this week. [1] Read the latest Nikkei225 news here.
Levels traders are watching
These are reference zones drawn from the current Nikkei 225 index chart, not trade signals.
| Level Type | Price | What It Marks |
| Near-term support | 63,370.53 | Session low on the current 15-minute candle |
| Broader support | 62,800 (round number) | Psychological zone below the session low |
| Resistance | 65,077.13 | 200-period MA on the TradingView setup used for this analysis |
| Resistance | 66,864.92 | 50-period MA; last week’s consolidation floor |
Table 1: Key levels on the Vantage Nikkei 225 (Japan Index Cash) CFD as of 12:46 (GMT+8), 17 July 2026. Source: TradingView: https://www.tradingview.com/symbols/TVC-NI225/ setup used for this analysis. Indicative only.
The session low at 63,370.53 sits as the nearest support in play, with the round-number 62,800 zone as the next broader support below that. On the upside, the 200-period MA at 65,077.13 is the first resistance the index would need to reclaim, followed by the 50-period MA at 66,864.92, which also marked the floor of last week’s consolidation range.
Traders following Nikkei 225 today news may find it useful to review how moving averages and the Relative Strength Index (RSI) are typically read together, alongside the wider range of index CFDs available on Vantage, including further background in the Nikkei 225 CFD trading guide.

Risk considerations
The scale of Friday’s move, more than 2,500 points at one stage, shows how quickly conditions can shift in a session like this one. [5] Traders monitoring exposure around the levels above may find it useful to revisit how a Stop Loss order limits losses to a planned size rather than preventing them, in fast-moving sessions. Background on risk management techniques is available on the Vantage Academy.
Leverage is a double-edged tool that magnifies both gains and losses in either direction, and it is worth revisiting position sizing relative to account equity in this kind of volatility, especially with the Nikkei 225 and related Japanese technology CFDs seeing outsized intraday swings this week. More on how leverage works is available on the Vantage terminology page.
RISK WARNING: CFDs are complex financial instruments and carry a high risk of losing money rapidly due to leverage. You should ensure you fully understand the risks involved and carefully consider whether you can afford to take the high risk of losing your money before trading.
Disclaimer: The information is provided for educational purposes only and doesn’t take into account your personal objectives, financial circumstances, or needs. It does not constitute investment advice. We encourage you to seek independent advice if necessary. The information has not been prepared in accordance with legal requirements designed to promote the independence of investment research. No representation or warranty is given as to the accuracy or completeness of any information contained within. This material may contain historical or past performance figures and should not be relied on. Furthermore estimates, forward-looking statements, and forecasts cannot be guaranteed. The information on this site and the products and services offered are not intended for distribution to any person in any country or jurisdiction where such distribution or use would be contrary to local law or regulation.
References
[1] “Japan’s Nikkei drops nearly 3% as chip stocks slide despite robust TSMC results – Reuters” https://www.tradingview.com/news/reuters.com,2026:newsml_L1N43I05J:0-japan-s-nikkei-drops-nearly-3-as-chip-stocks-slide-despite-robust-tsmc-results/ Accessed on 17 July 2026.
[2] “As Nikkei Bleeds, Kioxia’s Boom-to-Bust Highlights Dangers of This AI Cycle – Yahoo Finance / Reuters” https://finance.yahoo.com/markets/stocks/articles/nikkei-bleeds-kioxia-boom-bust-031605544.html Accessed on 17 July 2026.
[3] “Stock Market Today, July 16: Micron Plunges as Tech Stocks Extend Sell-Off – The Motley Fool” https://www.fool.com/coverage/stock-market-today/2026/07/16/stock-market-today-july-16-micron-plunges-as-tech-stocks-extend-sell-off/ Accessed on 17 July 2026.
[4] “Stock market news for July 16, 2026 – CNBC” https://www.cnbc.com/2026/07/15/stock-market-today-live-updates.html Accessed on 17 July 2026.
[5] “Nikkei 225 Plunges Over 2,500 Points at One Stage; AI and Semiconductor Sell-Off Drags Index to 64,300 Level – BigGo Finance” https://finance.biggo.com/news/b9fb7316-ff36-4c41-8162-7f93ee338b3d Accessed on 17 July 2026.
[6] “Japan’s Nikkei drops over 3% as chip stocks slide – Business Recorder (Reuters)” https://www.brecorder.com/news/40430304/japans-nikkei-drops-over-3-as-chip-stocks-slide Accessed on 17 July 2026.
[7] “Nikkei 225 Index Today (N225) – Investing.com” https://www.investing.com/indices/japan-ni225 Accessed on 17 July 2026.