


[DAILY TRADING] QCOM Analysis 28 July 2026 – Qualcomm Fights Its Own Chart Before Earnings

Vantage Editorial Team >
Vantage Editorial Team >
Vantage is a global, multi-asset broker with a team of in-house writers and market analysts who produce educational and insightful trading content for traders of all levels.
 Updated Tue, 2026 July 28 05:57
![[DAILY TRADING] QCOM Analysis 28 July 2026 – Qualcomm Fights Its Own Chart Before Earnings](https://www.vantagemarketsea.com/wp-content/uploads/2026/07/ChatGPT-Image-Jul-28-2026-01_54_50-PM.webp)
As of 04:43 UTC (12:43 GMT+8) on 28 July 2026, Qualcomm (Nasdaq: QCOM) traded at $170.07 on the Vantage QCOM CFD, up $0.43 (+0.25%), after moving between $169.19 and $170.43 intraday on the 15-minute chart. QCOM stock has spent most of July grinding lower, and this week the chart has boxed itself into a corner: Qualcomm stock now sits wedged between two moving averages, with third-quarter earnings landing before the session catches its breath.
Key Points
- QCOM stock price today sits between the 50-period moving average at $171.01 and the 200-period moving average at $168.08, per the TradingView setup used for this analysis.
- Qualcomm earnings for fiscal Q3 2026 land after the close on Wednesday, 29 July, with consensus pointing to revenue near $9.71 billion and EPS near $2.22.[1][2]
- Separately, Qualcomm news this week includes word the company has told customers to expect a double-digit percentage price rise on components.[4]
What the Chart Is Showing
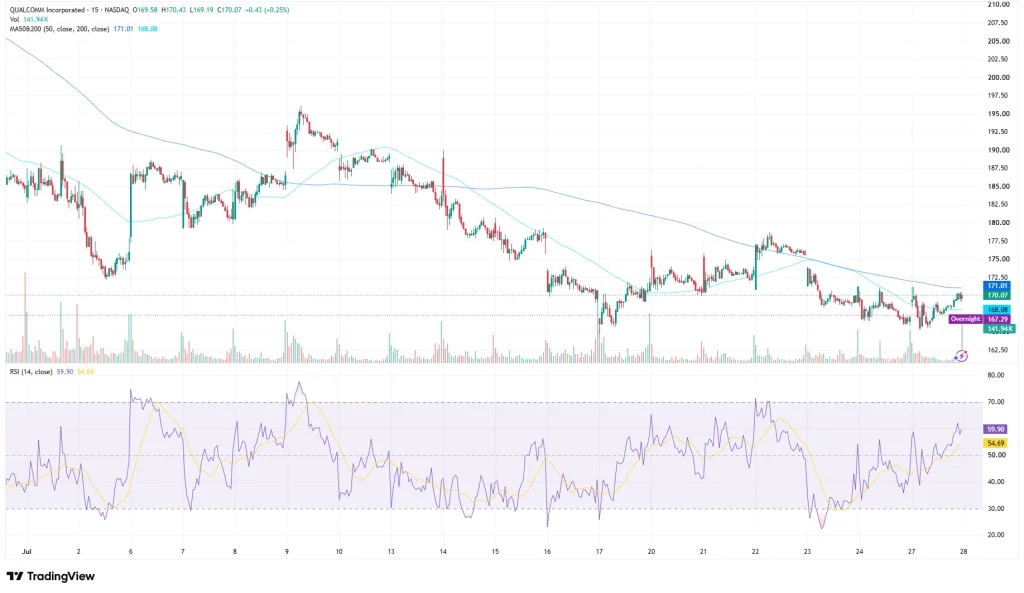
The 15-minute chart shows QCOM stock consolidating between $169.19 and $170.43, tighter than the swings that rattled it earlier in July. Price sits below the 50-period moving average at $171.01 and above the 200-period average at $168.08. It is a stock parked in a gap, waiting for something to push it out.
Zoom out and the story gets less polite. QCOM fell hard from the $195 area it touched in early July, with another pronounced leg lower between 13 and 17 July 2026, before falling to a late-July low around $165 on 27 July 2026. The bounce since has been patient rather than dramatic, and the 15-minute RSI, at 59.90 against a 14-period average of 54.69 on the TradingView setup used for this analysis, reads as mildly constructive rather than stretched. Volume on the latest bar came in at 141.94K, nothing that suggests anyone has made up their mind.
Qualcomm Earnings: What Wall Street Is Actually Watching

Qualcomm reports fiscal third-quarter 2026 results after the close on Wednesday, 29 July, and the Qualcomm stock forecast built into consensus is not cheerful. Zacks estimates point to revenue near $9.71 billion, down roughly 6.3% year over year, and EPS near $2.22, down close to 19.9%.[1][2]
If realised, those estimates would mark another quarter of year-over-year declines in both revenue and adjusted EPS. For context: the prior quarter, fiscal Q2 2026, reported 29 April, brought revenue of $10.6 billion, down 3% year over year, and non-GAAP EPS of $2.65, down 7%, according to Barchart.[3] Weaker numbers on paper still beat expectations, and the stock nevertheless rallied sharply following the release.[3] Soft guidance and a sharp rally are not mutually exclusive, and that tension is exactly what sets up Wednesday.
Analysts have leaned constructive on the longer view while trimming near-term numbers. Mid-July saw TD Cowen lift its price objective to $225 from $200, and HSBC raised its view to $180 from $155, per CNN.[5] Wall Street’s rating stays split between cautious and constructive camps.
A Price Hike Nobody Asked About
Buried under the earnings countdown: Qualcomm has reportedly told customers it will raise prices by a double-digit percentage on products shipped after 1 September, citing rising supplier costs, Bloomberg reported, as carried by the Motley Fool.[4] Reuters picked up the report but said it could not independently verify Bloomberg’s account of the letter. The reported increase could affect future margin and demand assumptions, depending on how much of the higher cost customers absorb.
Layer that onto existing questions around Qualcomm’s exposure to China smartphone demand and its push into PC, automotive, and edge AI semiconductor chips, and the picture turns genuinely mixed. A cost-driven price rise could protect margins if customers absorb it, or dent volumes if they push back. Neither the chart nor the earnings preview settles which way that goes.
Levels to Watch and Risk Considerations
The table below sets out the reference points traders are watching into Wednesday’s print. These are levels drawn from the chart, not a forecast of where price ends up.
| Reference | Level | Relative Position | What’s Happening |
| 50-period MA | $171.01 | Just above price | QCOM has traded on both sides of this level since mid-July; a close above puts it back on top |
| Current price | $170.07 | – | As of 04:43 UTC (12:43 GMT+8), 28 July 2026 |
| 200-period MA | $168.08 | Just below price | Currently below price and acting as a nearby technical reference |
| Late-July low | ~$165 | Below price | Prior swing low reached around 27 July |
Table 1: QCOM levels as of 04:43 UTC (12:43 GMT+8), 28 July 2026. Source: the TradingView setup used for this analysis. Indicative only.
A close above $171.01 would put QCOM above both moving averages on the current 15-minute setup. A break under $168.08 would put the recovery in question and bring the late-July low near $165 back into focus. Either way, the chart has made its terms clear even if direction is not.
With QCOM trading between the two moving averages ahead of earnings, the $168.08 to $171.01 range provides a useful reference for assessing near-term volatility and technical positioning, particularly given how sharply the stock has moved around past earnings releases.
Leverage is a double-edged tool this week, and this is not the moment to forget it. It can scale exposure to Wednesday’s reaction in either direction. Leverage magnifies both gains and losses, making overall risk exposure particularly relevant around an earnings release capable of producing sharp price moves in US share CFDs like QCOM.
RISK WARNING: CFDs are complex financial instruments and carry a high risk of losing money rapidly due to leverage. You should ensure you fully understand the risks involved and carefully consider whether you can afford to take the high risk of losing your money before trading.
Disclaimer: The information is provided for educational purposes only and doesn’t take into account your personal objectives, financial circumstances, or needs. It does not constitute investment advice. We encourage you to seek independent advice if necessary. The information has not been prepared in accordance with legal requirements designed to promote the independence of investment research. No representation or warranty is given as to the accuracy or completeness of any information contained within. This material may contain historical or past performance figures and should not be relied on. Furthermore estimates, forward-looking statements, and forecasts cannot be guaranteed. The information on this site and the products and services offered are not intended for distribution to any person in any country or jurisdiction where such distribution or use would be contrary to local law or regulation.
References
[1] “Qualcomm (QCOM) Laps the Stock Market: Here’s Why – Yahoo Finance” https://finance.yahoo.com/markets/stocks/articles/qualcomm-qcom-laps-stock-market-214504692.html Accessed on 28 July 2026.
[2] “Seeking Clues to Qualcomm (QCOM) Q3 Earnings? – Yahoo Finance” https://finance.yahoo.com/markets/stocks/articles/seeking-clues-qualcomm-qcom-q3-131510758.html Accessed on 28 July 2026.
[3] “QUALCOMM’s Q3 2026 Earnings: What to Expect – Barchart” https://www.barchart.com/story/news/3164893/qualcomms-q3-2026-earnings-what-to-expect Accessed on 28 July 2026.
[4] “Huge News for Qualcomm Stock Investors – The Motley Fool” https://www.fool.com/investing/2026/07/27/huge-news-for-qualcomm-stock-investors/ Accessed on 28 July 2026.
[5] “QCOM Stock Quote Price and Forecast – CNN” https://www.cnn.com/markets/stocks/QCOM Accessed on 28 July 2026.