


XOP vs OIH: Why Energy ETFs Didn’t All Run Together in 2026

Vantage Editorial Team >
Vantage Editorial Team >
Vantage is a global, multi-asset broker with a team of in-house writers and market analysts who produce educational and insightful trading content for traders of all levels.
 Updated Sat, 2026 July 25 02:00
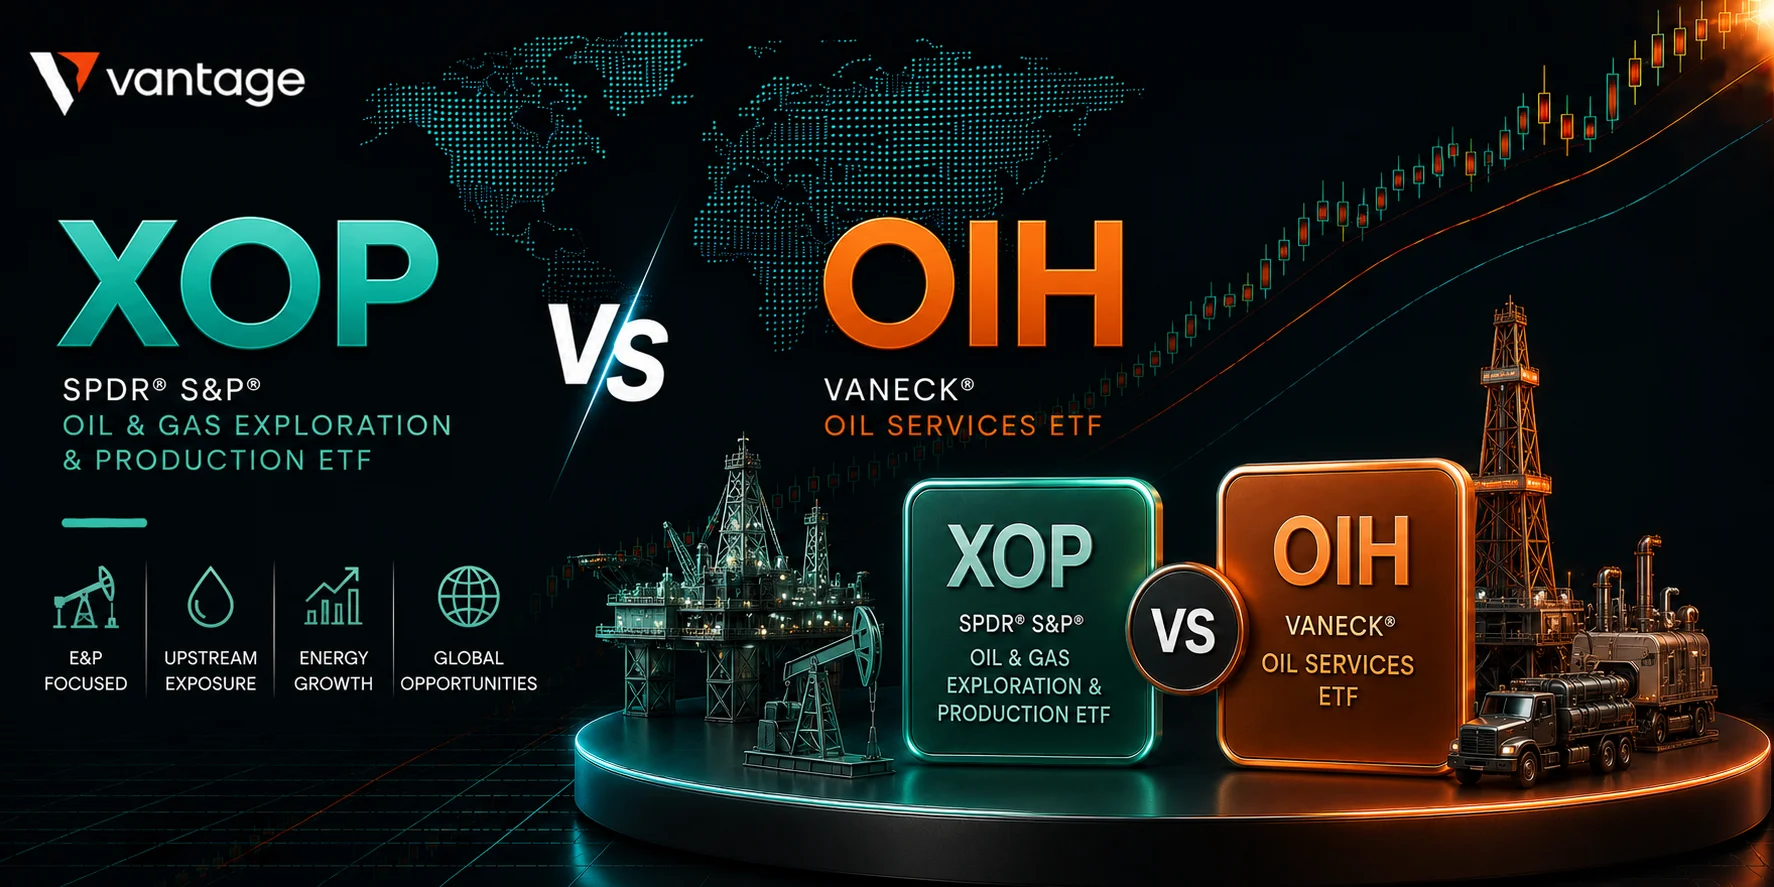
The energy sector was supposed to be simple this year. Oil spikes, energy stocks surge, done. What actually happened was more interesting.
The SPDR S&P Oil & Gas Exploration & Production ETF (XOP) and the VanEck Oil Services ETF (OIH) both caught the bid when the Strait of Hormuz disruption pushed WTI above $100. XOP surged 44.6% in Q1 2026 — the best-performing ETF in the entire sector.1 OIH wasn’t far behind at roughly 42% over the same period.1 Then came the divergence. By mid-July, with Brent crude back near $86, OIH had returned 60.24% over the trailing year against XOP’s 17.33%.2 Same commodity cycle. Very different outcomes.
The reason comes down to one question: are you betting on the price of a barrel today, or on whether producers will greenlight the next drilling cycle? XOP bets on the former. OIH bets on the latter. And in 2026, those are not the same trade.
All prices referenced as of 17 July 2026 unless stated. This is not financial advice.
Key points
- XOP holds around 50 equal-weighted US exploration and production companies and tracks spot oil prices directly. OIH holds around 26 oil services and equipment names, weighted toward SLB and Halliburton, and tracks producer capex decisions, not the spot price.
- WTI peaked at $114.58 on 7 April 2026 after the US imposed a naval blockade on Iran.2 The Strait of Hormuz closure shut in an estimated 10.5 million barrels per day of Middle East production at its peak.
- The EIA’s May 2026 Short-Term Energy Outlook projected Brent averaging $89 in Q4 2026 and $79 in 2027 — a trajectory that, if accurate, historically favours XOP, since OIH’s outperformance requires producers to commit meaningful capex in a sustained high-price environment.3
What XOP and OIH actually hold

The structural difference between these two funds is not style. It’s where in the oil supply chain the money sits.
XOP tracks the S&P Oil & Gas Exploration & Production Select Industry Index on an equal-weight basis. That means roughly 50 US E&P firms, from Exxon Mobil down to smaller independents like Coterra Energy and Magnolia Oil & Gas, each carry about a 2% weight.4 Equal weighting is the key: a small-cap E&P name gets the same exposure as a major. When oil spikes, those smaller producers move fastest and hardest. XOP captures that torque in a way the cap-weighted Energy Select Sector SPDR Fund (XLE) cannot, XLE is approximately 40% Exxon Mobil and Chevron, which smooths the ride in both directions.
OIH tracks the MVIS US Listed Oil Services 25 Index, around 26 oilfield services and equipment companies, with SLB and Halliburton holding the largest weights.5 These businesses provide the rigs, completion services, and wellbore equipment that producers need to drill. Their revenue depends not on where oil closes today, but on whether producers believe oil will be high enough for long enough to justify commissioning more wells.
That single distinction drives almost every performance difference between the two in 2026.
How the divergence played out in 2026
WTI opened 2026 near $57 per barrel.2 The US naval blockade on Iran in early April sent it through $100 within days, hitting $114.58 on 7 April. XOP caught the move immediately, equal-weight E&P names respond to spot price within sessions. Over Q1 2026, XOP returned 44.6%.1
Brent held above $100 from 11 May through 22 May as the Strait remained effectively closed and 10.5 million barrels per day of Middle East production stayed off the market.2 Over that stretch, the market started pricing something beyond a spot trade: sustained triple-digit oil meant producers would eventually have to spend on new capacity. OIH started running on the capex cycle thesis.
By mid-July, with WTI pulling back to the mid-$80s, the trailing-year picture looked like this: OIH had returned 60.24% against XOP’s 17.33%.2 But the past month told the other story, as crude faded, OIH dropped 9.48% in a week versus XOP’s 6.15% decline. Services names unwind faster when producers start reconsidering capex. XOP, with its direct spot-price link, tracks oil down more gradually.
XOP vs OIH: key structural differences

| Feature | XOP | OIH | What this means |
| Index | S&P E&P Select Industry (equal-weight) | MVIS US Listed Oil Services 25 (cap-weight) | XOP bets on crude prices; OIH bets on drilling capex cycles |
| Holdings | ~50 US E&P firms | ~26 services/equipment firms | OIH is more concentrated — SLB and Halliburton dominate |
| Revenue link | Direct: realised oil price | Indirect: producer capex budgets | OIH needs prices high long enough to unlock spend |
| Q1 2026 return | +44.6% | ~+42% | Both surged on the initial Hormuz spike |
| Trailing year (to 15 Jul) | +17.33% | +60.24% | OIH ran further once the capex cycle thesis held |
| 10-year return | +29.78% | -22.3% | Shale capital discipline since 2020 crushed OIH long-term |
| Expense ratio | 0.35% | 0.35% | Identical cost base |
Table 1: Structural comparison as of July 2026. Sources: 24/7 Wall St. (15 July 2026), ETF.com (Q1 2026). Indicative only.
The geopolitical premium and where it goes from here
Here’s the honest read: the 2026 energy trade has been almost entirely geopolitical. The Hormuz disruption did the work. The harder question is whether the macro backdrop that produced those Q1 gains can hold, or whether the EIA’s price path is the more useful frame.
The EIA’s May 2026 Short-Term Energy Outlook projected Brent averaging $89 in Q4 2026 and $79 in 2027.3 A glide toward the high $70s affects XOP and OIH very differently. XOP tracks spot oil directly, lower prices compress E&P margins, but the equal-weight structure means no institutional amplification of the move. For OIH, a sustained price decline removes the justification for the incremental capex spending that its trailing-year return has priced in. Wells Fargo Securities has argued that oilfield services demand should remain strong through year-end, but that view carries an implicit assumption about producer price confidence that the EIA’s 2027 outlook does not fully support.2
XLE sits between the two. The cap-weight structure means Exxon Mobil and Chevron, integrated majors with refining and chemicals exposure, drive most of XLE’s return. XLE returned 37.9% through Q1 2026.1 It tends to hold up better in a falling oil environment, because integrated majors generate free cash flow across a wider price range than pure-play E&P names.
The wildcard is a re-escalation. Brent bounced above $86 on 17 July as the ceasefire remained unresolved and fresh tanker attacks in the Red Sea revived supply fears.6 Any renewed disruption around the Strait would most directly affect XOP via spot crude, with OIH following on a lag if producers respond by accelerating domestic capex.
What to watch
- Brent direction: XOP tracks spot oil closely. A sustained move back above $100 rebuilds the XOP case. A decline toward the EIA’s $79 2027 forecast pressures both funds, OIH faces the steeper unwind.
- Strait of Hormuz developments: The single most relevant geopolitical variable for both funds. Formal closure or credible reopening would shift the entire energy sector narrative quickly.
- Q2 producer capex guidance: If Exxon Mobil, ConocoPhillips, and other major US E&P names raise 2026 capex in their Q2 results, OIH’s thesis gets fresh support. Cuts flip the advantage back to XOP.
- EIA weekly inventory reports: Sustained draws from US crude stockpiles support prices above the EIA’s own forecast. Inventory builds, particularly ahead of the seasonal demand trough, would pressure the oil price narrative for both funds.
- US dollar: Oil is dollar-denominated. A strengthening DXY creates a headwind for crude independent of supply factors, which affects XOP more directly than OIH.
Risk considerations
Both XOP and OIH carry concentrated exposure to a single commodity cycle driven by a geopolitical event — not a structural shift in supply economics. Market participants monitoring energy ETF CFDs typically approach Stop Loss placement with attention to the instruments’ amplified daily range. WTI moved from $57 to $114 and back toward the mid-$80s inside seven months. The gap between a defined risk level and its account impact can close inside a session during a crude price event.
XOP’s higher beta to spot crude means it tends to move faster in both directions than XLE or OIH during a crude price event. OIH can hold gains longer in a sustained high-price environment, but unwinds sharply when producer confidence weakens, as the July pullback illustrated. Traders holding positions across crude oil and energy equity ETFs simultaneously should assess their combined directional exposure.
In a sharp crude selloff, both funds can move in the same direction at the same time. For a broader view of how the energy value chain works, the Vantage guide to oil and gas stocks explains the structural difference between upstream, midstream, and downstream exposure.
Leverage amplifies both favourable and unfavourable outcomes. Energy sector CFDs can experience wide intraday ranges during crude price events and geopolitical headlines. Revisiting position sizing relative to total account equity — not just the margin required to open a trade — is a practical step before entering any energy ETF CFD position.

RISK WARNING: CFDs are complex financial instruments and carry a high risk of losing money rapidly due to leverage. You should ensure you fully understand the risks involved and carefully consider whether you can afford to take the high risk of losing your money before trading.
Disclaimer: The information is provided for educational purposes only and doesn’t take into account your personal objectives, financial circumstances, or needs. It does not constitute investment advice. We encourage you to seek independent advice if necessary. The information has not been prepared in accordance with legal requirements designed to promote the independence of investment research. No representation or warranty is given as to the accuracy or completeness of any information contained within. This material may contain historical or past performance figures and should not be relied on. Furthermore estimates, forward-looking statements, and forecasts cannot be guaranteed. The information on this site and the products and services offered are not intended for distribution to any person in any country or jurisdiction where such distribution or use would be contrary to local law or regulation.
References
[1] “The Best Performing ETFs of 2026 — ETF.com” https://www.etf.com/sections/features/best-performing-etfs-2026 Accessed on 24 July 2026.
[2] “XOP vs. OIH: Do Drillers or Service Providers Best Ride Crude Above $100? — 24/7 Wall St.” https://247wallst.com/investing/2026/07/15/xop-vs-oih-do-drillers-or-service-providers-best-ride-crude-above-100/ Accessed on 24 July 2026.
[3] “XOP vs OIH: E&P or Oil Services for Energy Exposure? — 24/7 Wall St.” https://247wallst.com/investing/2026/06/23/xop-vs-oih-ep-or-oil-services-for-energy-exposure/ Accessed on 24 July 2026.
[4] “Navigating the Energy Surge: A Value-Chain Guide to Energy ETFs — ETF Trends” https://www.etftrends.com/thematic-investing-content-hub/navigating-energy-surge-value-chain-guide-to-energy-etfs/ Accessed on 24 July 2026.
[5] “OIH vs XOP: Performance Charts & Full Comparison — PortfoliosLab” https://portfolioslab.com/tools/stock-comparison/OIH/XOP Accessed on 24 July 2026.
[6] “Current price of oil as of July 17, 2026 — Fortune” https://fortune.com/article/price-of-oil-07-17-2026/ Accessed on 24 July 2026.
[7] “Investors Rotate into Energy ETFs (XLE, XOP) as Geopolitical ‘Bunker’ Assets — Financial Content” https://markets.financialcontent.com/stocks/article/marketminute-2026-4-13-investors-rotate-into-energy-etfs-xle-xop-as-geopolitical-bunker-assets Accessed on 24 July 2026.
[8] “A Guide to Oil and Gas Stocks — Vantage Markets” https://www.vantagemarketsea.com/academy/oil-gas-stock/ Accessed on 24 July 2026.
[9] “ETF Trading Strategies — Vantage Markets” https://www.vantagemarketsea.com/etf-trading/etf-trading-strategies/ Accessed on 24 July 2026.