


XAUUSD Weekly Analysis: $220 Wipeout, a 200-Day MA Break and Recovery, and an Unfinished Story

Vantage Editorial Team >
Vantage Editorial Team >
Vantage is a global, multi-asset broker with a team of in-house writers and market analysts who produce educational and insightful trading content for traders of all levels.
 Updated Fri, 2026 May 29 05:28

Gold prices endured one of the sharpest weekly swings of 2026 during the week of 26–29 May. The Vantage XAUUSD CFD opened the week near $4,560–$4,580, sold off sharply through Wednesday, hit an intraday low of approximately $4,360–$4,375 on Thursday 28 May, then staged a recovery above $4,500 by the week’s close.
As of 02:02 UTC on 29 May 2026, the Vantage XAUUSD CFD was trading near $4,508.96. All prices in this article are sourced from the Vantage XAUUSD CFD and cited external sources unless stated otherwise. Charts are from TradingView and are indicative only. This is not financial advice.
Four forces shaped this week’s gold price action: reports of alleged US military action near Iran that coincided with a sharp sell-off to two-month lows, a combination of weak US GDP data and an Axios-reported 60-day ceasefire extension that coincided with the sharp Thursday reversal, April Core PCE inflation data released on 29 May that came in softer than expected and coincided with the recovery, and a broader fiscal backdrop that kept the longer-term case for gold intact even as short-term pressure mounted.
This weekly analysis covers those dynamics alongside key levels and latest market developments. The Vantage XAUUSD CFD was down approximately 1% for May 2026 and sits roughly 20% below its January 2026 all-time high of $5,595.42, a reminder that rate expectations have been capping gold even as geopolitical risk has remained elevated throughout the year.
XAUUSD Chart: The Week in Gold Prices
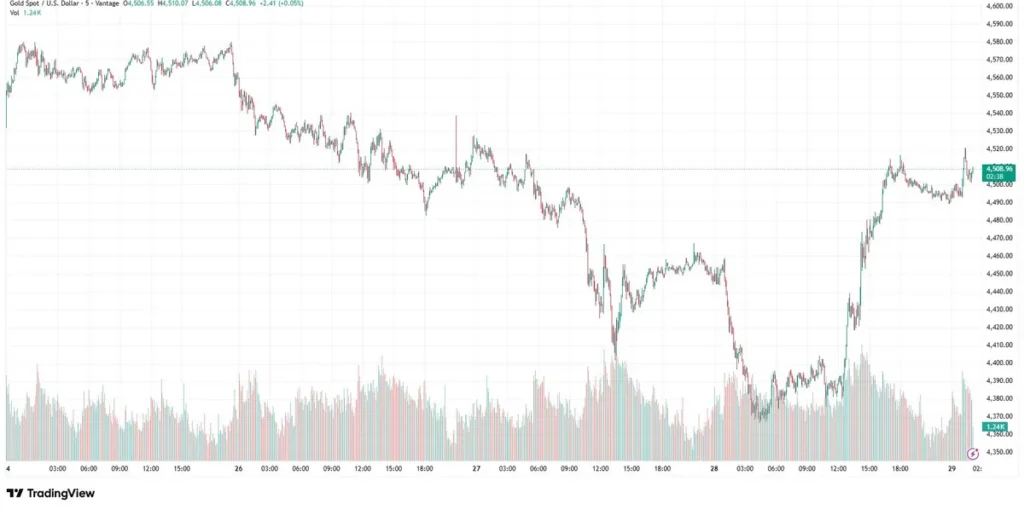
The 5-minute Vantage XAUUSD CFD chart (26–29 May 2026) captures a week that divided cleanly into two halves. The first half was defined by distribution and a controlled sell-off; the second by a sharp flush and an equally sharp recovery.
From Monday 26 May, sellers took progressive control after a brief hold near $4,560–$4,585, pushing the Vantage XAUUSD CFD toward $4,490–$4,500 by the session close. Selling extended into 27 May, with a midday recovery to $4,530 stalling before reversing.
The sharpest move of the week came on 28 May. FXEmpire’s analysis stated that the Vantage XAUUSD CFD opened near $4,457, crashed to a weekly low of $4,366.23, then reversed more than $150 to reach $4,516.63, a session gain of over 1% on a day that started with sellers in full control.[3]
The low coincided with two catalysts arriving in quick succession: weak US GDP data for Q1 2026 and, according to FXStreet’s reporting, an Axios report that Washington and Tehran had reached a deal to extend the ceasefire for 60 days, with nuclear talks to follow, news that sent the US Dollar lower and eased inflation fears linked to the Hormuz closure.[7]
The weekly low of $4,366.23 sat approximately $28 below the 200-day moving average at $4,394.70 — the market breached it intraday before recovering back above it. Volume on the Vantage CFD feed spiked sharply at the low, consistent with capitulation selling before buyers stepped in.[3]
By the end of 29 May, the Vantage XAUUSD CFD was trading in the $4,449–$4,502 range, down approximately 1% for May 2026.
FXEmpire cited that a sustained close above $4,481.78 — its bull/bear dividing line — is the condition needed for the Thursday reversal to carry weight as a genuine turning point rather than a temporary bounce.[3] The week ended with gold holding above the $4,500 level that forex.com identifies as the key immediate support to monitor, but the month-end close reflected a market still navigating the tension between geopolitical uncertainty and persistent rate-hike risk.[4]
Key Gold Price Levels for the Week Ahead
The table below consolidates the reference zones visible on the Vantage XAUUSD CFD chart alongside key moving average levels from external analysis. These are informational levels, not trade signals.
| Zone | Level (USD) | Type | Notes |
| R3 | 4,630–4,650 | Resistance | 50-day MA ceiling per FXEmpire[3] |
| R2 | 4,580–4,590 | Resistance | Weekly high zone; repeatedly failed — forex.com[4] |
| R1 | 4,530–4,540 | Resistance | 27 May intraday ceiling; visible on Vantage CFD chart |
| Current | ~4,509 | 29 May 2026 | Vantage XAUUSD CFD as of 02:02 UTC |
| S1 | 4,481–4,500 | Support | Bull/bear line per FXEmpire; key level per forex.com[3][4] |
| S2 | 4,366–4,395 | Support | 28 May weekly low ($4,366.23); 200-day MA at $4,394.70[3] |
| S3 | ~4,099 | Deep support | March 2026 corrective low; prior 200-day MA bounce[3] |
Table 1: Key XAUUSD gold price levels as of 29 May 2026. Sources: Vantage XAUUSD CFD via TradingView; FXEmpire[3]; Forex.com[4]. Indicative only.
Gold News: The Macro Drivers Behind This Week’s Move
Three macro themes shaped the weekly gold price action and each of them carries forward into next week:
1. US-Iran ceasefire uncertainty
One important driver of gold volatility this week was shifting sentiment around a potential US-Iran peace agreement. The sell-off through 26–28 May coincided with reports of alleged US military action near Bandar Abbas, which contributed to uncertainty over peace negotiations and kept inflationary and rate-hike concerns in focus.[7]
The reversal that followed coincided with an Axios report on 28 May that Washington and Tehran had agreed in principle to a 60-day ceasefire extension, with nuclear talks to resume during that window.[7] Forex.com’s analysis noted that peace hopes provided some dollar weakness and near-term support for gold prices, but that the options market was signalling caution — with traders unwilling to fully price in a durable resolution.[4]
Reports as of 29 May 2026 suggested negotiations were continuing, alongside discussions relating to regional shipping security, though disagreements over final framework wording continued to delay a formal signing.[8] This tension — near-term deal optimism versus ongoing sticking points — remains a major geopolitical consideration for XAUUSD.
2. Weak GDP and the 200-day moving average reversal
Thursday’s sharp move was driven by two catalysts: weak US Gross Domestic Product (GDP) data, which markets read as pointing toward lower rates, and the Axios ceasefire report.[3]
[7] That recovery should be read against the broader backdrop: Core PCE remains at 3.3% annually, Treasury yields are elevated amid persistent inflation concerns, and FOMC minutes pointed to rate hikes rather than cuts as the next policy move.
[5][9] FXEmpire cautioned that reversal confirmation depends on whether gold can sustain a close above $4,481.78 — if it cannot, the session risks being characterised as a temporary bounce rather than a genuine trend change.[3]
3. Fiscal backdrop and the Moody’s downgrade
The longer-term macro backdrop for gold remained supportive even as short-term price action turned volatile. The US House passed the One Big Beautiful Bill Act on 22 May 2025, legislation widely reported to add significantly to the federal deficit over the coming decade.[1]
A Moody’s sovereign credit downgrade, announced on 16 May 2025, had already set the tone for elevated fiscal concern.[2] Historically, dollar weakness and fiscal deterioration have coincided with elevated gold prices, though rising Treasury yields simultaneously weigh on non-yielding assets — a tension that may have contributed to the volatile XAUUSD price action seen this week.[5]
CME FedWatch data as of 29 May 2026 priced approximately a 60% probability of a December rate hike, while April FOMC minutes revealed officials openly discussing rate hikes rather than cuts, reinforcing the headwind for gold.[9]
XAUUSD Technical Analysis: What to Watch Next Week
The following events and levels appear most relevant to the XAUUSD picture heading into the week of 2 June 2026:
- US Core PCE result, 29 May 2026 (published): April Core PCE printed at 3.3% year-on-year (0.2% month-on-month), below the prior 0.3% monthly rise. The softer reading coincided with the DXY easing from its seven-week high of 99.54, moderating near-term rate-hike risk without removing it, inflation remains well above the Fed’s 2% target.[6][10]
- $4,481–$4,500 support zone, ongoing: The immediate reference to hold for the Thursday reversal to carry weight. FXEmpire places $4,481.78 as the bull/bear dividing line; forex.com identifies $4,500 as the level a decisive break below would be technically negative.[3][4]
- $4,580–$4,590 resistance, ongoing: The weekly ceiling that gold failed to clear on every recovery attempt. Forex.com notes the next upside levels beyond there sit near $4,650.[4]
- 200-day moving average (~$4,394), ongoing: Held as the weekly low and the floor of the reversal. A return to and breach of this level would represent a significant technical deterioration from a multi-session perspective.[3]
- US-Iran ceasefire developments, ongoing: A major geopolitical consideration for gold this week and next. Reports suggested negotiations were continuing alongside discussions relating to regional shipping security, though key sticking points over Iran’s nuclear programme and final framework wording continued to delay a formal agreement.[8] A completed deal would likely reduce the geopolitical premium in gold; a breakdown or fresh military escalation reinstates it.[4][7]
- ISM Services PMI, 3 June 2026: A key gauge of US services activity; a surprise in either direction could shift near-term Fed rate expectations and affect gold pricing.[4]
- US Non-Farm Payrolls (NFP), 6 June 2026: The May jobs report is the next major macro catalyst. A strong reading adds rate-hike pressure; a weak one revives rate relief expectations. April NFP beat consensus nearly twofold yet failed to lift gold — rate expectations dominate over growth data.[3]
Given the $220+ weekly range in XAUUSD, traders may wish to review their risk parameters ahead of upcoming event risks. Reviewing Stop Loss settings relative to current volatility and exposure across correlated positions is consistent with sound risk management practice.
Leverage amplifies both the upside and downside of moves like those seen this week — it works in both directions. Position sizing relative to account equity is worth reviewing ahead of the Iran deal headlines and NFP release. CFDs are complex instruments and carry a high risk of losing money rapidly due to leverage.
RISK WARNING: CFDs are complex financial instruments and carry a high risk of losing money rapidly due to leverage. You should ensure you fully understand the risks involved and carefully consider whether you can afford to take the high risk of losing your money before trading.
Disclaimer: The information is provided for educational purposes only and doesn’t take into account your personal objectives, financial circumstances, or needs. It does not constitute investment advice. We encourage you to seek independent advice if necessary. The information has not been prepared in accordance with legal requirements designed to promote the independence of investment research. No representation or warranty is given as to the accuracy or completeness of any information contained within. This material may contain historical or past performance figures and should not be relied on. Furthermore estimates, forward-looking statements, and forecasts cannot be guaranteed. The information on this site and the products and services offered are not intended for distribution to any person in any country or jurisdiction where such distribution or use would be contrary to local law or regulation.
References
[1] “US House passes One Big Beautiful Bill Act: fiscal impact — Reuters” https://www.reuters.com/world/us/trump-tax-bill-passes-house-what-is-in-it-2025-05-22/ Accessed on 29 May 2026.
[2] “United States of America credit rating downgraded to Aa1 — Moody’s Ratings” https://www.moodys.com/web/en/us/about-us/usrating.html Accessed on 29 May 2026.
[3] “Gold (XAUUSD) Price Forecast: Weak GDP Sparks Bullish Reversal at 200-Day MA — FXEmpire” https://www.fxempire.com/forecasts/article/gold-xauusd-price-forecast-weak-gdp-sparks-bullish-reversal-at-200-day-ma-1600919 Accessed on 29 May 2026.
[4] “Gold Outlook: Peace Hopes Support Gold, Options Market Signals Caution — Forex.com” https://www.forex.com/en-us/news-and-analysis/gold-outlook-peace-hopes-support-gold-options-market-signals-caution/ Accessed on 29 May 2026.
[5] “CME FedWatch Tool — Federal Reserve rate probabilities” https://www.cmegroup.com/markets/interest-rates/cme-fedwatch-tool.html Accessed on 29 May 2026.
[6] “Gold rebounds from two-month low as US Dollar eases on fresh US-Iran truce headlines — FXStreet” https://www.fxstreet.com/news/gold-drops-to-fresh-two-month-low-as-markets-focus-on-inflation-risks-us-pce-data-202605281207 Accessed on 29 May 2026.
[7] “Gold rebounds from two-month lows as Iran deal hopes weaken USD — FXStreet” https://www.fxstreet.com/news/gold-rebounds-from-two-month-lows-as-iran-deal-hopes-weaken-usd-202605282022 Accessed on 29 May 2026.
[8] “Gold Price Forecast: Upcoming PCE Inflation after US-Iran Talks — FX Leaders” https://www.fxleaders.com/news/2026/05/24/gold-price-forecast-upcoming-pce-inflation-after-us-iran-talks-reduce-the-xau-appeal/ Accessed on 29 May 2026.
[9] “Federal Open Market Committee minutes, April 28-29 2026 meeting — Federal Reserve” https://www.federalreserve.gov/monetarypolicy/fomcminutes20260429.htm Accessed on 29 May 2026.
[10] “United States Core PCE Price Index Annual Change — Trading Economics” https://tradingeconomics.com/united-states/core-pce-price-index-annual-change Accessed on 29 May 2026.